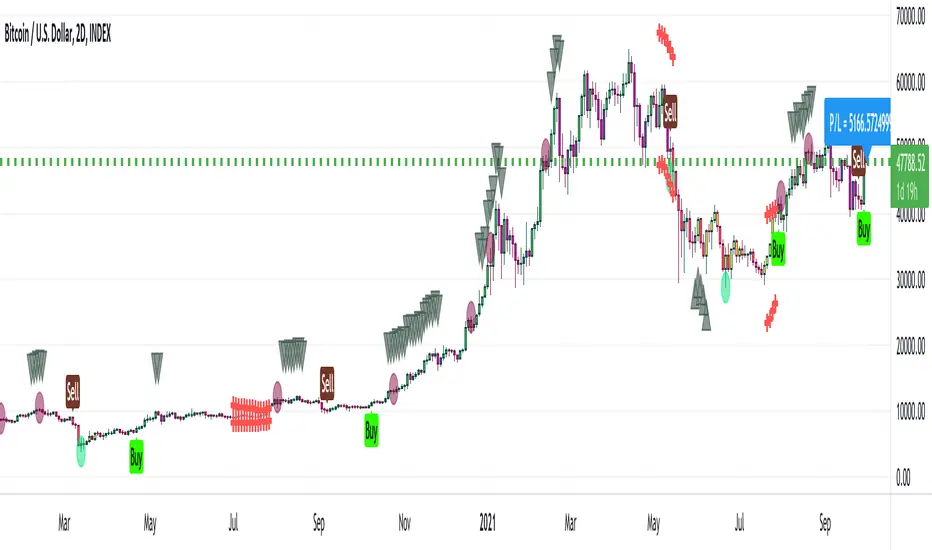
[Joy] Aladdin (1.0.0 Alpha)Explanation of the markers in the indicator
* Bearish / Sell sign: On the candle's close, I open a short position
* Bullish sign: On the candle's close, I open a long position
* Red circle: On the candle's close, I take at least 50% unrealized profit into a realized profit of any running long leverage position. I might even convert some portion of the position into stable coins.
* Green circle: On the candle's close, I take at least 50% unrealized profit into a realized profit of any running short leverage position. I might even convert some portion of the position into stable coins.
* Down Arrows: When the down arrow finishes and the candle close, I put a tighter stop loss of any running long leverage position. It sometimes indicates the local top.
* Up Arrows: When the up arrow finishes and the candle close, I put a tighter stop loss of any running short leverage position. It sometimes indicates the local bottom.
* Purple candle: Weakly bullish.
* Green candle: Strongly bullish
* Red candle: Strongly bearish
* Yellow candle: Weakly bearish
FAQ
Q: Does it use some EMA /MA/etc.? Does it use any indicator with tweaked settings?
Answer: No.
Q: What does it mostly depend on?
Answer: Volume and gradual flow of non-interrupted data. The logic depends purely on volume, price bars and the wicks.
Q: Does it work with all coins, stocks, futures, instruments?
Answer: I prefer to use the exchange with the best possible data. Then backtest out to find the best possible timeframe, stop loss and target all derived from this script data.
Q: Can you make it free or make it open source?
Answer: There is no free lunch in this world. I will never reveal or share the source code!
Q: Do you provide ongoing support for the indicator?
Answer: Yes, as long as I can, I will continue updating the indicator
Q: Are the bullish /buy & the bearish /sell markers automatic?
Answer: I have no control over the markers. It is driven purely by logic from the script.
Q: Is this financial advice?
Answer: This is not financial advice. I do not guarantee any profit or loss. I am not responsible for any of your losses or profits. My indicators do not assure profit or loss. It also does not auto-open or auto-close a trade.
Note:
The Aladdin has been derived from the Super Algorithm Indicator. I have depreciated the Super Algorithm Indicator I have automatically migrated every user to Aladdin, who had Super Algorithm Indicator. One should not use the SA indicator. One should start using this indicator instead.
Version 1
A derived version of Super Algorithm Indicator with optimized code (uses arrays, removes few warnings in the code, makes code more reusable) so that I can add further features in the future. A few new coding features in the pine script encouraged me to go for this version. Since the codebase has been revamped, it made sense for me to make it a new indicator. have also changed a small parameter that is configurable at the moment. Previously it was valued at 26. Now I am putting value at 21.
Search in scripts for "stop loss"
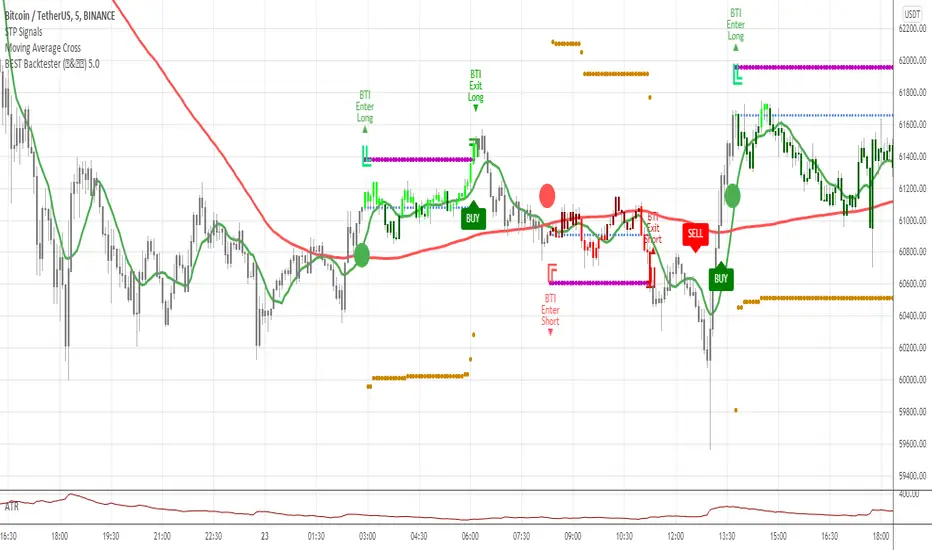
Backtest PREMIUM Suite+ (Plug & Play)Hello traders
I. 💎 SCRIPTS ACCESS AND TRIALS 💎
1. For the trial request access, they have to be done through my website .
2. My website URL is in this script signature at the very bottom (you'll have to scroll down a bit and going past the long description) and in my profile status available here : Daveatt
Due to the new scripts publishing house rules, I won't mention the URL here directly. As I value my partnership with TradingView very much, I prefer showing you the way for finding them :)
3. Many video tutorials explaining clearly how all our indicators work are available on our website > guides section.
4. You may also contact me directly for more information
II. 🔎 Backtest PREMIUM Suite+ (Plug & Play) 🔎
2.1 Forewords
This indicator is available only to our PREMIUM 12 months users. YES! I said indicator, and not strategy or backtest for an excellent reason.
We wanted to make it as generic as possible and allow anyone to connect any indicator of his/her choice in a few clicks only.
This is NOT possible (in TradingView) with a strategy/backtest, but only with an indicator - that's why we worked on recoding the whole backtest logic as an indicator.
The PRO edition does not handle any pyramiding/re-entry - as such enters only once per trend by design. This feature is reserved for our PREMIUM users.
2.2 Concept
This is an indicator that I saw on TradingView and was introduced by the @Pinecoders account on TradingView.
I inspired myself from his Backtest Engine to offer a version more adapted to my vision - The benefits of connecting yourself any indicator to our Backtest engine are amazing and huge.
The concept can't be more simple. Imagine using any indicator and connecting to a backtest system in a single click.
You may connect your Algorithm Builder also to this complete backtesting system in a single click.
What's better between paying thousands for each backtest, or connecting yourself your indicators to your backtest with a click?
That was a rhetoric question, but you can still share your answer with me if you want to :)
III. The amazing benefits of our🔌&🕹️ (Plug&Play) system
Issue #1 💲 A BACKTEST SYSTEM IS COSTLY 💲
Hiring a developer to code a custom indicator is costly. For a custom backtest it's even more expensive as those scripts are very often way more complicated.
Now imagine, that now that you see your idea live on a chart, you'll realize you'll have to finance another backtest system, as the one you have is not compatible with your new idea.
Solution #1 💲💲 YOU COULD BE SAVING SOME MONEY 💲💲
just because it won't be needed to hire someone else for each of your trading idea.
We will never guarantee your success on the market, but THIS I stand by it any day any hour.
You can connect any indicator or your choice by updating your indicator slightly and connecting it to our Backtest engine. We send the tutorial for doing it to all our customers.
Issue #2 🕔 IT'S TIME-CONSUMING 🕔
Even if someone is doing all the coding for you, it might require days/weeks depending on your overall trading strategy/idea.
Without even counting the time for you to test/validate the work done and all the back-and-forth to fix all the issues.
Solution #2 SAVING TIME MIGHT EQUATES TO SAVING MONEY : 🕔 = 💲💲💲
I wish it could be as easy as going from weeks of coding to "1 single click" :)
I did the heavy-lifting, but you'll have to make the last effort the cross the finishing line. I made it easy for you to play with it and find a configuration that makes sense to YOU and for your strategy/asset/timeframe
Issue #3 ❌ IT'S COMPLICATED ❌
Someone did a backtest code for you, but... you can't update it because you either :
- don't know anything in programming
- ... and don't have time to learn (most of us have a job/family/...life)
- The system you have is way too specific for one of your previous idea, but can't be updated easily for your next trading ideas. I see a lot of traders nodding right now thinking "that's soooooo true !!!!"
Solution #3 🎉 WE MADE IT EASY AND FUN 🎉
Our goal is to externalize the technical stuff that you don't want to take care of - so that you can finally focus on your trading and optimizing your ideas. #bold #statement
In case you're wondering, no we're not reading your mind :), but we're also traders who didn't know how to code before and had to hire external programmers to do the heavy work for us.
You can be sure that most of the frustrations (trading, technical, ...) you have/had, we had them also and that's why we created this backtest indicator.
III. 🔌&🕹️
Hope you're ready to be impressed. Because, what I'm about to introduce, is my best-seller feature - and available across many of my indicators.
In TradingView, there is a feature called "Indicator on Indicator" meaning you can use an external indicator as a data source for another indicator.
I'm using that feature to connect any external indicator to our Backtest PREMIUM Suite+ (Plug & Play) - hence the plug and play name. Please don't make it a plug and pray :) it's supposed to help you out, not to stress you even more
Let's assume you want to connect your Algorithm Builder Multiple Trends+ to your Backtest PREMIUM Suite+
I mentioned an Algorithm Builder but you may connect any oscillator (MACD, On balance volume, stochastic RSI, True Strenght index, and many more..) or non-oscillator (divergence, trendline break, higher highs/lower lows, candlesticks pattern, price action, harmonic patterns, ...) indicators.
THE SKY IS (or more likely your imagination) is the limit :)
Fear no more. The Plug&Play technology allows you to connect it and use it the backtest calculations.
This is not magic, neither is sorcery, but certainly is way beyond the most awesome thing I've ever developed on TradingView (even across all brokers I know). #bolder #statement
TradingView is the best trading platform by far and I'm very grateful to offer my indicators on their website.
To connect your external indicator to ours, we're using a native TradingView feature, which is not available for all users.
It depends on your TradingView subscription plan ( More info here )
If you intend to use our Algorithm Plug&Play indicator, and/or our Backtest Plug&Play suites, then you must upgrade your TradingView account to enjoy those features.
We value our relationship with our customers seriously, and that's why we're warning you that a compatible TradingView account type is required - at least PRO+ or PREMIUM to add more than 1 Plug&Play indicator per account.
We go in-depth on our website why the Plug&Play is an untapped opportunity for many traders out there - URL available on my profile status and signature
IV. 📊 Make it nice! 📊
Now we're getting right into the fun stuff.
Let's explore briefly each display option (symbolized by an 👁️🗨️ in the Backtest UI) :
- Color Traded Background : Color the chart background is green when in a BUY trade, in red when in a SELL trade. If the Backtest is not in a trade, then the background won't be colored.
- Show Entry/Exit Markers : Displays the entries (Enter Long/Enter Short), and exits (Exit Long/Exit Short) labels.
- Show Entry Level : Displays a blue level line to easily identify the entry price of a trade.
- Show Take Profit Level : Display a purple line to visualize where the Take Profit level is (we'll explain below how to set it up).
- Show In-Trade Stops : Display the stop-loss
V. Backtesting filters
A backtest should have some filters helping the traders testing a few hypotheses. Well.... we included a ton of them.
Once again, thank you @Pinecoders for the help and support you gave me
5.1 ↑ Trade Direction ↓
- Both: The backtest takes the BUY, and SELL trades.
- Longs only/Short only: To be used if the trader wants to take the trades in a unique direction only
5.2 ▲🔷Pyramiding🔷▼
The Backtest PRO allows 1 entry per identified trend
Pyramiding has many names such as Re-entry, secondary trend, Additional entry, ...
Basically, it refers to entering multiple times in the same trend.
Maximum Number of Pyramiding Entries: Literally the max number of re-entries in the same trend.
For instance, if set to 2, then depending on the signals, you'll get at most 2 re-entries in the same trade direction.
- Position Size Multiple of Original Entry Position: Option to add X multiples of the original position size for the re-entries.
Example: Position size multiple = 2, and First entry size is $100. Then, the re-entries position sizes will be ($100 X 2 = $200).
5.3 ▄ █ Position sizing █ ▄
- 1. % of Equity: If selected, the position size used is the input to the right of 1. % of Equity.
Example: The trader starts with a capital of 100K. After a winning trade, your total capital is $103K - for the next trade the position size will be 3% of $103K
- 2. % of Capital: If selected, the position size used is the input to the right of 2. % of Capital.
In other words, the position size will always be the same position size as calculated on the initial capital.
Example: The trader starts with a capital of 100K. After a winning trade, your total capital is $103K - for the next trade the position size will be 5% of $100K. (As 100K is the initial capital used in our dummy example)
5.4⛔ Entry Stops and In-Trade Stops ⛔
We didn't reinvent the wheel here. Any good backtest should offer an entry stop-loss and an in-trade stop-loss.
Giving only here also an example among all the use cases. For instance, the trader sets a stop-loss 2% at the time of entry on your trade, but once the trade moves in the desired direction, the trader might want a trailing stop-loss using a 4% input.
Example: A trader goes LONG on only 1 "ABC" stock evaluated $10 per share.
1) The entry-stop loss will be 2% away so set at $8
2) A candle
3) The trailing stop will activate, and move the stop-loss from the entry stop-loss level (=$8) to $8.32 (=4% move up from $8) - and so on, and so forth for each time the price moves 4% up
The entry and in-trade stop losses can absolutely be identicals. There is no universal rule, and as always you know the drill - all depends on your backtest, and trading strategy as a whole.
5.5 ❌ Hard Exits ❌
⚠️The Backtest PRO Suite offers the hard exit on MACD only.
Our Backtest PREMIUM Suite offers 2 more indicators to invalidate your trades on :
1. MACD
2. Trend Direction
3. RSI divergence (Regular, and Hidden)
The hard exit (or invalidation) is a fundamental part of my trading method.
I explained numerous times on TradingView, our website, and social media channels why I "love" this concept so much, and how it saved my trading account numerous times from getting savagely wrecked by the market.
5.6 💲💲 Take Profit 💲💲
We only included 1 level of Take Profit so far. We'll work on adding at least one more soon.
You can set your Take Profit level based on either a:
1- Fixed value
2 - Percentage value
5.7 📆 Date Range Filtering 📆
If enabled, the backtest only uses the data between the starting and the ending dates of the defined range.
5.8 ⏱️ Hourly Range Filtering ⏱️
Please note that the hours filtering is based on the broker time - not on your chart time.
In other words, if your chart is UTC+1, but you're trading an asset from a US EAST COAST broker, then the timezone used is the UTC-4 timezone.
You'll must be wary of this when filtering and probably do a quick (but simple) calculation before setting up this option.
The easiest would be to set your chart timezone on the broker local timezone (and no math is needed).
Let's add a quick note that the hourly filter is also included in our Algorithm Builders PRO/PREMIUM 12 months. #shameless #self #advertising
5.9 ❗❗ Fees and Slippage ❗❗
Too often completely ignored by many traders, the fees can eat gains out quickly/deepen one's capital faster than expected.
⚠️The fees vary between brokers, and asset traded - it could be recommended to check on your broker page what are the fees for the asset on your chart, and insert that percentage number.
Another cost ignored, even more, is the Slippage.
i.e. think about a Stop-Loss being hit, and we're so confused because we see on the chart that NEVER the price came even close to your SL level, but... it got hit anyway.
Yes! we know how frustrating it is, but that's the game we're playing, and trading should never be about blaming the game, but only blaming the players/traders/ourselves.
Blaming the game constantly is likely to not end with good performance results, but accounting for this "risk", and being able to quantify it is an incredible hedge. #bold #statement #level #10000
5.10 🔔 Alerts 🔔
By design, the alerts aren't available for strategy scripts. But this script is an... indicator so why should we not enjoy all the cards in our hands the fullest.
We enabled the alerts on the:
1. Main BUY/SELL Entry
2. Pyramiding BUY/SELL Entries
3. Exit Signals such as stop-loss, take-profit, hard-exits
You're welcome :)
VI. 📝 Where are the backtest results? 📝
Answer: in the Data Window section of your TradingView
Now the cherry on the cake if we might say so. A backtest is cool, but visualizing results is actually the end goal here.
Our PREMIUM users benefit from way more analytics than the PRO users.
More info available on our website.
The Data Window is dynamic - it means whenever you'll mouseover at a give time on your chart, the data on that panel automatically updates.
Let's assume you're backtesting your idea between Sept 1st, 2019, and Oct 1st, 2019.
If your mouse cursor is located (or hovered) at a candle on Sept 14th, 2019 (data chosen randomly for this example), then the data displayed only includes the results between Sept 1st, and Sept 14th.
More info available on our website with a nice tutorial video. Data window metrics and filters explained on our website
Here's what the data window looks like: imgur.com
If you have any doubt or question, please hit me up directly or ask in the comments section of this script.
I'll never claim I have the best trading methodology or the best indicators.
You only will judge and I'll appreciate all the questions and feedback you're sending my way.
They help me a ton to develop indicators based on all the requests I received.
Kind regards,
Dave
Strategy Builder Crypto V6Hello everyone
This indicator is the result of 7 years of trading (including 3 years of analyzing day and night how crypto assets behave).
I made it fully customizable but I wouldn't recommend changing the default values as they're the most optimal ones for now. Might change in the future but I'm very happy with the signals so far and I hope you'll be as well :)
Without further due, let's dig into it...
0 - Algo trading and Why
In the crypto trading, there is a lot of useless noise (we can probably thank Crypto Twitter for that :p) and a lot of useless data with the sole purpose is to lure you (who said Bitfinex Long/Short ratio or CME gaps ??)
I wanted to remove all the useless and only focus on Technical Analysis (TA) because I was deeply convinced that TA includes by design Fundamental Analysis (FA) and Pumponomics Analysis (PA) - PA being for instance when your favorite twitter guru will pump and dump on you
I heard that so many people got REKT from the previous bear market and I wanted to give back to the community - who helped me so much a few years back.
I worked hard to design the method and make it simple for the public and for FREE (so far as I want to collect feedbacks from the community and improving the indicator)
THIS IS MY GIFT TO YOU
1 - Input values
I'll explain later on through a medium article what each parameter means and how to set them up. For now, please used the optimized and recommended values already set in the indicator
2 - The method
This method works for intraday trading for timeframes between m5 and H1. Any timeframe above could work but would give signals too late - in this case, I would recommend changing the inputs with smaller values to adjust
I see a trend being composed of a main trend, and mini sub trends. In other words, for instance, a weekly bullish trend is made of smaller H4 bullish trends. Hope it makes sense so far
Let's call the weekly trend the MAIN trend and the H4 smaller trends the SECONDARY trends
That's exactly what this indicator is about
It will catch the best MAIN trend and all the SECONDARY trends in the same direction of the MAIN trend.
It's up to you if you want to take all the SECONDARY trends or only the first one in the sequence.
3 - Invalidation signal
A signal invalidation is used to make you exiting your position with a small loss before your stop loss will get hit. Very powerful way to save your capital and limit your losses.
You'll find the indicator here on tradingview for free under the name Trend signal with Alert (made by myself)
Trend signal with Alert
to invalidate entries. You'll need to request an invite
Briefly, let's assume we get a BUY signal. I would exit the position either if I'm getting a DOWN trend signal. It means, if the oblique/logarithmic trendline is broken, then it's better to exit the position and wait for the indicator to give another BUY signal later hopefully
Best case, it will limit your loss in case the asset will dump.
Worst case, this strict management strategy will make you exiting your position for no reason and you'll re-enter later (with a signal) at almost the same price or a bit higher
In the long run, this method will prevent you from having big losses
4 - Stop Loss and Take profits levels
It's really up to you. It depends of your capital and psychology
This indicator is made to give big moves but that's not 100% guaranteed. You can draw some trendlines or use moving averages in big timeframes to set your take profit and stop loss levels.
I personally use this also, along with fibonacci on the weekly/monthly timeframes for my take profit levels
As I'm a nice person, I'm linking the Fibonacci indicator that I use here
Automatic Multi-timeframes fibonacci zones
. You'll also need to request an invite for that one
4-bis - Trailing stop
Not financial advice but I use a supertrend and I have a software that will trail my stop according to that supertrend level
For LONG positions, we could set the trailing below the supertrend.
For SHORT positions, we could set the trailing above the supertrend.
You'll find the indicator here on tradingview for free under the name Supertrend V1.0 - Buy or Sell Signal
5 - Which assets
It's working with the default values on major/mid/small caps and for ALTS/BTC, ALTS/USD and ALTS/ETH pairing
YES, THIS IS MOST AWESOME THING OF THE ENTIRE UNIVERSE !!!
6 - Best setup
m15 timeframe is my preferred one for this method. Best Risk/Reward/Invalidations ratio among all other timeframes
I strongly recommend to use the Trend Signal with the input value 14 for the invalidations
If you enter on a BUY signal, and get a RED trend signal, exit immediately the position without waiting for any other confirmation/pullback or anything else
If you enter on a SELL signal, and get a BLUE trend signal, exit immediately the position without waiting for any other confirmation/pullback or anything else
For the trailing stop/Supertrend value, it depends of your capital and how big your stop loss should be. I personally use the settings in the Supertrend indicator
7 - Alerts
You can setup alerts for the primary and secondary signals in Tradingview so that you won't have to stare at the charts all day long. You mental healthy is my priority above everything else :)
8 - More to come
I personally use the alerts from this indicator coupled with a system to take the trades given by the tradingview alerts. I'll publish it later on if I feel the indicator collects enough interest from you guys

Ghost Scalp Protocol By [@Ash_TheTrader]
# 👻 GHOST SCALP PROTOCOL
### 💀 Stop Getting Trapped. Start Tracking the Banks.
Most retail traders lose because they enter exactly where institutions are exiting. They get caught in **"Stop Hunts"** and **"Fake-Outs."**
The **Ghost Scalp Protocol** is not just an indicator; it is a complete institutional trading system designed for **M1 & M5 Scalpers**. It combines **Smart Money Concepts (SMC)** with a **Physics-Based Momentum Engine ($p=mv$)** to detect high-probability reversals.
---
### ⚛️ THE LOGIC: 3-STAGE CONFIRMATION
This algorithm does not rely on lagging indicators. It uses a 3-step "Protocol" to validate every trade:
**1. THE GHOST TRAP (Liquidity Sweeps)**
* The script automatically draws "Ghost Lines" at key Swing Highs/Lows where retail Stop Losses are hiding.
* It waits for price to **sweep** these levels (Stop Hunt).
* **The Signal:** A Neon **Skull (☠️)** appears *only* if price aggressively rejects the level with high volume. This is the "Turtle Soup" pattern.
**2. THE PHYSICS ENGINE ($p = mv$)**
* Momentum is not just price speed; it is **Mass (Volume) x Velocity (Range)**.
* The dashboard calculates the "Force" of every candle.
* **The Signal:** An **Arrow (⬆/⬇)** appears when momentum surges **5x** above the average. This confirms the banks are pushing the move.
**3. BANK BIAS (Elasticity Filter)**
* Markets move like a rubber band.
* The script calculates a hidden "Fair Value" baseline.
* It creates a **Bias**: It only looks for Shorts in **PREMIUM (Shorting)** zones and Longs in **DISCOUNT (Accumulating)** zones.
---
### 📊 THE SMART DASHBOARD (HUD)
A futuristic, non-intrusive Heads-Up Display keeps you focused on the data that matters:
* **🏦 BANK BIAS:** Tells you if Institutions are likely **Accumulating** or **Shorting**.
* **📈 HTF TREND:** Automatically checks the **1-Hour Trend**. Don't fight the tide.
* **🚀 MOMENTUM:** Real-time Physics calculation.
* **Green Text:** Acceleration (Move is getting stronger).
* **Red Text:** Deceleration (Move is dying).
* **🌍 SESSION:** Shows active Bank Sessions (Tokyo, London, NY).
* **⚠️ OVERLAP ALERT:** Flashes GOLD when London & New York are open simultaneously (Peak Volatility).
---
### 🔥 STRATEGY: HOW TO TRADE
Use this checklist to execute high-probability scalps:
#### 📉 SHORT SETUP (SELL)
1. **Liquidity:** Wait for price to break above a **Red Ghost Line** (Sweep Highs).
2. **Signal:** Wait for the **Pink Skull ☠️** (Trap Detected).
3. **Confluence:**
* Dashboard Bias says: **"SHORTING"**
* HTF Trend says: **"BEARISH 📉"** (Optional but recommended).
4. **Entry:** On the Close of the Skull candle.
5. **Stop Loss:** Just above the wick swing high.
#### 📈 LONG SETUP (BUY)
1. **Liquidity:** Wait for price to break below a **Blue Ghost Line** (Sweep Lows).
2. **Signal:** Wait for the **Blue Skull ☠️** (Trap Detected).
3. **Confluence:**
* Dashboard Bias says: **"ACCUMULATING"**
* HTF Trend says: **"BULLISH 📈"** (Optional but recommended).
4. **Entry:** On the Close of the Skull candle.
5. **Stop Loss:** Just below the wick swing low.
---
### 🏆 RECOMMENDED PAIRS & TIMEFRAMES
* **⚡ Best Timeframes:**
* **1 Minute (M1):** For aggressive "Sniper" entries (High Frequency).
* **5 Minute (M5):** The "Gold Standard" for balanced Scalping.
* **15 Minute (M15):** Safer, higher win-rate Day Trading.
* **💎 Best Assets:**
* **Gold (XAUUSD):** Highly effective on liquidity sweeps.
* **Indices:** US100 (Nasdaq), US30 (Dow Jones).
* **Crypto:** BTCUSD, ETHUSD (High volatility).
* **Forex:** GBPUSD, EURUSD (London/NY Session).
---
### 🛠️ SETTINGS & CUSTOMIZATION
* **Surge Factor:** Default is **5.0x**. Lower this to 3.0 if you want more aggressive Momentum Arrows.
* **Smart Sessions:** Automatically converts to **New York Time** (EST) regardless of your location. No more time zone math.
* **Visuals:** Designed with "Ghost Glow" technology—97% transparent backgrounds that look classy and don't clutter your chart.
---
**"The Ghost Algo sees what you can't."**
*Trade Safe. Trade Smart.*
**~ Ash_TheTrader**

ORB Algo⚡ ORB Strategy + Backtesting (Pine Script v5)
This script implements a complete Opening Range Breakout (ORB) strategy, featuring built-in backtesting, advanced TP/SL visualization, full style customization, and a performance dashboard. It is designed for traders who want to clearly evaluate breakout performance directly on the chart.
🕑 ORB Window Configuration
🔹 Session selection: choose between Market Timezone or Custom Session.
🔹 Timezone support: configurable from UTC-8 to UTC+12.
🔹 Daily limit: option to allow only one trade per day.
🔹 Risk/Reward (RR) settings:
Configurable TP1, TP2, and TP3 levels.
Stop Loss calculated dynamically from the ORB range.
📊 Backtesting Engine
🔹 Interactive dashboard showing trades, wins, losses, and win rate.
🔹 Adjustable partial exits for each TP (TP1, TP2, TP3).
🔹 Automatic calculation of percentage-based profit and loss.
🔹 Tracks total trades, total profit, and average profit per trade.
🎨 Visual Customization
🔹 Fully customizable colors:
ORB high/low lines and range fill.
Buy/Sell entry labels.
TP and SL lines with background zones.
🔹 Line style and thickness options (solid, dotted, dashed).
🔹 Visibility controls for each TP/SL level.
🔹 Clear profit and loss zones drawn directly on the chart.
🚀 Trading Logic
🔹 LONG entries: triggered when price breaks above the ORB high.
🔹 SHORT entries: triggered when price breaks below the ORB low.
🔹 Automatic calculation of Stop Loss and TP1, TP2, TP3 based on ORB range and RR.
🔹 Customizable BUY / SELL labels displayed at entry.
✅ TP / SL Detection
🔹 Real-time detection of TP1, TP2, TP3, and SL hits.
🔹 Prevents double counting of the same level.
🔹 Extended TP/SL lines with shaded zones for better clarity.
📈 Backtesting Dashboard
🔹 Displayed in the top-right corner of the chart.
🔹 Shows:
Total trades
Wins / Losses
Win rate (%)
Total profit (%)
Average profit per trade
🔹 Fully customizable panel color.
✨ Summary
This script combines:
Opening Range detection
Breakout trading logic with advanced risk management
Professional-grade visualizations
Integrated historical performance tracking
High customization for sessions, styles, and colors
💡 Ideal for traders who want to trade ORB setups with clarity, structure, and measurable results.

ORB Strategy + Backtesting (fixed timestamp) - Lines Adjusted⚡ ORB Strategy + Backtesting (Pine Script v5)
This script implements a complete Opening Range Breakout (ORB) strategy, featuring built-in backtesting, advanced TP/SL visualization, full style customization, and a performance dashboard. It is designed for traders who want to clearly evaluate breakout performance directly on the chart.
🕑 ORB Window Configuration
🔹 Session selection: choose between Market Timezone or Custom Session.
🔹 Timezone support: configurable from UTC-8 to UTC+12.
🔹 Daily limit: option to allow only one trade per day.
🔹 Risk/Reward (RR) settings:
Configurable TP1, TP2, and TP3 levels.
Stop Loss calculated dynamically from the ORB range.
📊 Backtesting Engine
🔹 Interactive dashboard showing trades, wins, losses, and win rate.
🔹 Adjustable partial exits for each TP (TP1, TP2, TP3).
🔹 Automatic calculation of percentage-based profit and loss.
🔹 Tracks total trades, total profit, and average profit per trade.
🎨 Visual Customization
🔹 Fully customizable colors:
ORB high/low lines and range fill.
Buy/Sell entry labels.
TP and SL lines with background zones.
🔹 Line style and thickness options (solid, dotted, dashed).
🔹 Visibility controls for each TP/SL level.
🔹 Clear profit and loss zones drawn directly on the chart.
🚀 Trading Logic
🔹 LONG entries: triggered when price breaks above the ORB high.
🔹 SHORT entries: triggered when price breaks below the ORB low.
🔹 Automatic calculation of Stop Loss and TP1, TP2, TP3 based on ORB range and RR.
🔹 Customizable BUY / SELL labels displayed at entry.
✅ TP / SL Detection
🔹 Real-time detection of TP1, TP2, TP3, and SL hits.
🔹 Prevents double counting of the same level.
🔹 Extended TP/SL lines with shaded zones for better clarity.
📈 Backtesting Dashboard
🔹 Displayed in the top-right corner of the chart.
🔹 Shows:
Total trades
Wins / Losses
Win rate (%)
Total profit (%)
Average profit per trade
🔹 Fully customizable panel color.
✨ Summary
This script combines:
Opening Range detection
Breakout trading logic with advanced risk management
Professional-grade visualizations
Integrated historical performance tracking
High customization for sessions, styles, and colors
💡 Ideal for traders who want to trade ORB setups with clarity, structure, and measurable results.

JAM ORB Algo⚡ ORB Strategy + Backtesting (Pine Script v5)
This script implements a complete Opening Range Breakout (ORB) strategy, featuring built-in backtesting, advanced TP/SL visualization, full style customization, and a performance dashboard. It is designed for traders who want to clearly evaluate breakout performance directly on the chart.
🕑 ORB Window Configuration
🔹 Session selection: choose between Market Timezone or Custom Session.
🔹 Timezone support: configurable from UTC-8 to UTC+12.
🔹 Daily limit: option to allow only one trade per day.
🔹 Risk/Reward (RR) settings:
Configurable TP1, TP2, and TP3 levels.
Stop Loss calculated dynamically from the ORB range.
📊 Backtesting Engine
🔹 Interactive dashboard showing trades, wins, losses, and win rate.
🔹 Adjustable partial exits for each TP (TP1, TP2, TP3).
🔹 Automatic calculation of percentage-based profit and loss.
🔹 Tracks total trades, total profit, and average profit per trade.
🎨 Visual Customization
🔹 Fully customizable colors:
ORB high/low lines and range fill.
Buy/Sell entry labels.
TP and SL lines with background zones.
🔹 Line style and thickness options (solid, dotted, dashed).
🔹 Visibility controls for each TP/SL level.
🔹 Clear profit and loss zones drawn directly on the chart.
🚀 Trading Logic
🔹 LONG entries: triggered when price breaks above the ORB high.
🔹 SHORT entries: triggered when price breaks below the ORB low.
🔹 Automatic calculation of Stop Loss and TP1, TP2, TP3 based on ORB range and RR.
🔹 Customizable BUY / SELL labels displayed at entry.
✅ TP / SL Detection
🔹 Real-time detection of TP1, TP2, TP3, and SL hits.
🔹 Prevents double counting of the same level.
🔹 Extended TP/SL lines with shaded zones for better clarity.
📈 Backtesting Dashboard
🔹 Displayed in the top-right corner of the chart.
🔹 Shows:
Total trades
Wins / Losses
Win rate (%)
Total profit (%)
Average profit per trade
🔹 Fully customizable panel color.
✨ Summary
This script combines:
Opening Range detection
Breakout trading logic with advanced risk management
Professional-grade visualizations
Integrated historical performance tracking
High customization for sessions, styles, and colors
💡 Ideal for traders who want to trade ORB setups with clarity, structure, and measurable results.

DCA Ladder CalculatorThis script is a DCA (Dollar-Cost Averaging) Ladder Calculator with Risk & Leverage Management baked in.
It’s designed for both LONG and SHORT positions, and helps you:
🎯 Strategically scale into positions across multiple entry points
🔐 Control risk exposure via defined capital allocation
⚖️ Utilize leverage responsibly — for efficiency, not destruction
🧮 Visualize risk, stop loss level, and entry distribution
🔁 Adapt to trend reversals or key zones, especially when combined with reversal indicators or higher timeframe signals
🧠 How It Works
This tool takes a capital allocation approach to building a ladder of positions:
1. You define:
- Portfolio value
- Risk per trade (as %)
- Leverage
- Number of DCA levels
- Entry multiplier (e.g. 1x, 2x, 4x...)
2. The script then:
- Calculates total margin to risk = Portfolio × Risk %
- Calculates total leveraged position size = Margin × Leverage
- Distributes entries according to exponential weights (1x, 2x, 4x...), totaling 7 for 3 levels
- Calculates per-entry:
- Entry price (based on price zone spacing)
- Multiplier
- Exact margin per entry
- Leverage per entry (margin × leverage)
- Computes:
- Average entry price (margin-weighted)
- Approximate stop loss level based on recent ATR and price structure
- % drawdown to SL
- Total margin and position size
3. Displays all this in a clean on-chart table.
📈 How to Use It
1. Apply the indicator to a chart (default: 1D — ideal for clean zones).
2. Configure your:
- Portfolio Value (total trading capital)
- Risk per Trade (%) (your acceptable loss)
- Leverage (exchange or strategy-based)
- DCA Levels (e.g. 3 = anchor + 2 entries)
- Multiplier (typically 2.0 for doubling)
3. Choose LONG or SHORT mode depending on direction.
4. The table will show:
- Entry price ladder
- Margin used per entry
- Total position size
- Approx. stop loss (where your full risk is defined)
Use in conjunction with price action, S/R zones, trendline breaks, volume divergence, or reversal indicators.
✅ Best Practices for Using This Tool
- Leverage is a tool, not a weapon. Use it to scale smartly — not recklessly.
- Use fewer, higher-conviction entries. Don’t blindly ladder; combine with price structure and signals.
- Stick to your risk percent. Never risk more than you can afford to lose. Let this calculator enforce discipline.
- Combine with other confirmation tools, like RSI divergence, momentum shifts, OB zones, etc.
- Avoid martingale-style over-exposure. This is not a gambling tool — it’s for capital efficiency.
🛡️ What This Tool Does NOT Do
- This is not a trade signal indicator.
- It does not place trades or auto-manage positions.
- It does not replace personal responsibility or strategy — it's a tool to help apply structure.
⚠️ Disclaimer
This script is for educational and informational purposes only.
It does not constitute financial advice, nor is it a recommendation to buy or sell any financial instrument.
Always consult a licensed financial advisor before making investment decisions.
Use of leverage involves high risk and can lead to substantial losses.
The author and publisher assume no liability for any trading losses resulting from use of this script.

Buy Sell SignalBuy Sell Signal - EMA Crossover with Dynamic Risk Management
OVERVIEW
This indicator combines a dual EMA crossover system with ATR-based dynamic stop loss and take profit levels to provide complete trade management signals. Unlike basic EMA crossover scripts, this tool automatically calculates and displays entry points, stop losses, and take profit targets based on market volatility, offering traders a complete trading framework in a single indicator.
HOW IT WORKS
The indicator uses three core components working together:
Trend Detection: A fast EMA (default 5) and slow EMA (default 13) identify trend direction. When the fast EMA crosses above the slow EMA, it signals bullish momentum; when it crosses below, it signals bearish momentum.
Entry Validation: Optional candle confirmation filter ensures the crossover is accompanied by a bullish/bearish candle close, reducing false signals in choppy markets.
Risk Management: Uses ATR (Average True Range, default 14 periods) to calculate:
Stop Loss: Positioned below/above recent swing low/high minus ATR multiplier (default 0.5x)
Take Profit: Calculated using customizable risk-reward ratio (default 3:1)
KEY FEATURES
✅ Automatic Position Tracking: Monitors active trades and displays current position status (LONG/SHORT/No position)
✅ Visual Trade Management: Shows entry price (white dashed line), stop loss (red line), and take profit (green line) in real-time
✅ Trade Outcome Signals: Displays clear markers when TP is hit (🎯), SL is triggered (❌), or position is invalidated by opposite signal
✅ Information Dashboard: Live table showing entry price, SL, TP, and actual R:R ratio
✅ Smart Position Invalidation: Automatically closes and invalidates previous positions when opposite trend signal appears
✅ Customizable Alerts: Five alert conditions for BUY/SELL signals, TP hits, SL triggers, and invalidations
INPUTS
Fast EMA Length (default 5): Responsive to recent price action
Slow EMA Length (default 13): Defines broader trend direction
ATR Period (default 14): Volatility measurement period
SL Multiplier (default 0.5): Distance from swing point to stop loss
Risk:Reward Ratio (default 3.0): Target profit relative to risk
Candle Confirmation (default ON): Requires bullish/bearish candle on crossover
HOW TO USE
Apply the indicator to your chart (works on all timeframes)
Adjust EMA periods based on your trading style (shorter for scalping, longer for swing trading)
Set your preferred risk-reward ratio
Enable alerts for automated notifications
When a BUY/SELL signal appears, the indicator automatically calculates and displays your complete trade plan
Monitor the information table for live position updates
Exit when TP is reached or SL is triggered
TRADING METHODOLOGY
This script implements a momentum-following strategy based on exponential moving average crossovers, enhanced with volatility-adjusted risk parameters. The ATR-based stop loss adapts to market conditions—wider stops in volatile markets, tighter stops in calm markets. The position invalidation feature prevents traders from holding outdated positions when market sentiment shifts.
BEST PRACTICES
Use on trending markets for best results
Higher timeframes (4H, Daily) produce fewer but more reliable signals.
For scalpe use 5 and 15 minutes(Risk).
Consider market context and fundamental factors alongside signals
Adjust ATR multiplier based on asset volatility
Test different EMA combinations for your preferred instruments
ORIGINALITY
While EMA crossover systems are common, this script's value lies in its complete integration of entry logic, dynamic risk management, position tracking, and automated invalidation—features typically requiring multiple separate indicators. The ATR-based stop loss calculation and automatic R:R visualization provide practical trade execution guidance that basic crossover indicators lack.
Important Notes:
This indicator does not guarantee profitable trades
Always practice proper risk management
Backtest settings on historical data before live trading
Past performance does not indicate future results

(CRT) MTF Candle Range Theory Model# 🚀 **CASH Pro MTF – Candle Range Theory (CRT) Indicator**
**The Smart Money ICT Setup Detector** 🔥
Hey Traders!
Here is the **ultimate Pine Script indicator** that automatically detects one of the most powerful Smart Money / ICT setups: **Candle Range Theory (CRT)**
---
### What is Candle Range Theory – CRT?
**CRT** is a high-probability price action model based on **liquidity grabs** and **range expansion**.
Price loves to:
1️⃣ Raid the low/high of the previous candle (take stop-losses)
2️⃣ Then reverse and run to the opposite side of the range (or beyond)
When this happens near a **key higher-timeframe level**, magic happens!
### Bullish CRT Model
- Price touches a **strong HTF support**
- Previous candle closes near that support
- Next candle **sweeps the low** (grabs liquidity)
- Current candle **closes above the raided low AND breaks the high** of the sweep candle
**Result → Aggressive bullish move expected!**
**Entry:** On close above the high (or on retest + MSS)
**Stop Loss:** Below the swept low
**Take Profit:** CRT High or next liquidity pool
### Bearish CRT Model
- Price touches a **strong HTF resistance**
- Previous candle closes near resistance
- Next candle **sweeps the high** (grabs buy stops)
- Current candle **closes below the raided high AND breaks the low** of the sweep candle
**Result → Strong bearish expansion!**
**Entry:** On close below the low
**Stop Loss:** Above the swept high
**Take Profit:** CRT Low or next downside liquidity
This whole setup can form in **just 3 candles**… or sometimes more if price consolidates after the sweep.
---
### Why This Indicator is Special
This is **NOT** a simple 3-candle pattern scanner!
This is a **true CRT + MTF confluence beast** with:
- **Multi-Timeframe Confirmation** (default 4H – fully customizable)
- **Built-in RSI Filter** (avoid fake moves in overbought/oversold)
- **Day-2 High/Low Levels** automatically drawn (the exact CRT range!)
- **Clean “LONG” / “SHORT” labels** right on the candle (no ugly arrows or offset)
- **Background highlight** on signal
- **Fully grouped inputs** – super clean settings panel
---
### Features at a Glance
| Feature | Included |
|--------------------------------|----------|
| Higher Timeframe Confirmation | Yes |
| RSI Overbought/Oversold Filter | Yes |
| Day-2 High/Low Lines + Labels | Yes |
| Clean Text Signals (no offset) | Yes |
| Background Highlight | Yes |
| Fully Customizable Colors & Text| Yes |
| Works on All Markets & TFs | Yes |
---
### How to Use
1. Add the indicator to your chart
2. Wait for a **LONG** or **SHORT** label to appear
3. Confirm price is near a **key HTF level** (order block, FVG, etc.)
4. Enter on close or retest (your choice)
5. Manage risk with the drawn Day-2 levels
**Pro Tip:** Combine with ICT Market Structure Shift (MSS) or Fair Value Gaps for even higher accuracy!

Luxy Super-Duper SuperTrend Predictor Engine and Buy/Sell signalA professional trend-following grading system that analyzes historical trend
patterns to provide statistical duration estimates using advanced similarity
matching and k-nearest neighbors analysis. Combines adaptive Supertrend with
intelligent duration statistics, multi-timeframe confluence, volume confirmation,
and quality scoring to identify high-probability setups with data-driven
target ranges across all timeframes.
Note: All duration estimates are statistical calculations based on historical data, not guarantees of future performance.
WHAT MAKES THIS DIFFERENT
Unlike traditional SuperTrend indicators that only tell you trend direction, this system answers the critical question: "What is the typical duration for trends like this?"
The Statistical Analysis Engine:
• Analyzes your chart's last 15+ completed SuperTrend trends (bullish and bearish separately)
• Uses k-nearest neighbors similarity matching to find historically similar setups
• Calculates statistical duration estimates based on current market conditions
• Learns from estimation errors and adapts over time (Advanced mode)
• Displays visual duration analysis box showing median, average, and range estimates
• Tracks Statistical accuracy with backtest statistics
Complete Trading System:
• Statistical trend duration analysis with three intelligence levels
• Adaptive Supertrend with dynamic ATR-based bands
• Multi-timeframe confluence analysis (6 timeframes: 5M to 1W)
• Volume confirmation with spike detection and momentum tracking
• Quality scoring system (0-70 points) rating each setup
• One-click preset optimization for all trading styles
• Anti-repaint guarantee on all signals and duration estimates
METHODOLOGY CREDITS
This indicator's approach is inspired by proven trading methodologies from respected market educators:
• Mark Minervini - Volatility Contraction Pattern (VCP) and pullback entry techniques
• William O'Neil - Volume confirmation principles and institutional buying patterns (CANSLIM methodology)
• Dan Zanger - Volatility expansion entries and momentum breakout strategies
Important: These are educational references only. This indicator does not guarantee any specific trading results. Always conduct your own analysis and risk management.
KEY FEATURES
1. TREND DURATION ANALYSIS SYSTEM - The Core Innovation
The statistical analysis engine is what sets this indicator apart from standard SuperTrend systems. It doesn't just identify trend changes - it provides statistical analysis of potential duration.
How It Works:
Step 1: Historical Tracking
• Automatically records every completed SuperTrend trend (duration in bars)
• Maintains separate databases for bullish trends and bearish trends
• Stores up to 15 most recent trends of each type
• Captures market conditions at each trend flip: volume ratio, ATR ratio, quality score, price distance from SuperTrend, proximity to support/resistance
Step 2: Similarity Matching (k-Nearest Neighbors)
• When new trend begins, system compares current conditions to ALL historical flips
• Calculates similarity score based on:
- Volume similarity (30% weight) - Is volume behaving similarly?
- Volatility similarity (30% weight) - Is ATR/volatility similar?
- Quality similarity (20% weight) - Is setup strength comparable?
- Distance similarity (10% weight) - Is price distance from ST similar?
- Support/Resistance proximity (10% weight) - Similar structural context?
• Selects the 15 MOST SIMILAR historical trends (not just all trends)
• This is like asking: "When conditions looked like this before, how long did trends last?"
Step 3: Statistical Analysis
• Calculates median duration (most common outcome)
• Calculates average duration (mean of similar trends)
• Determines realistic range (min to max of similar trends)
• Applies exponential weighting (recent trends weighted more heavily)
• Outputs confidence-weighted statistical estimate
Step 4: Advanced Intelligence (Advanced Mode Only)
The Advanced mode applies five sophisticated multipliers to refine estimates:
A) Market Structure Multiplier (±30%):
• Detects nearby support/resistance levels using pivot detection
• If flip occurs NEAR a key level: Estimate adjusted -30% (expect bounce/rejection)
• If flip occurs in open space: Estimate adjusted +30% (clear path for continuation)
• Uses configurable lookback period and ATR-based proximity threshold
B) Asset Type Multiplier (±40%):
• Adjusts duration estimates based on asset volatility characteristics
• Small Cap / Biotech: +40% (explosive, extended moves)
• Tech Growth: +20% (momentum-driven, longer trends)
• Blue Chip / Large Cap: 0% (baseline, steady trends)
• Dividend / Value: -20% (slower, grinding trends)
• Cyclical: Variable based on macro regime
• Crypto / High Volatility: +30% (parabolic potential)
C) Flip Strength Multiplier (±20%):
• Analyzes the QUALITY of the trend flip itself
• Strong flip (high volume + expanding ATR + quality score 60+): +20%
• Weak flip (low volume + contracting ATR + quality score under 40): -20%
• Logic: Historical data shows that powerful flips tend to be followed by longer trends
D) Error Learning Multiplier (±15%):
• Tracks Statistical accuracy over last 10 completed trends
• Calculates error ratio: (estimated duration / Actual Duration)
• If system consistently over-estimates: Apply -15% correction
• If system consistently under-estimates: Apply +15% correction
• Learns and adapts to current market regime
E) Regime Detection Multiplier (±20%):
• Analyzes last 3 trends of SAME TYPE (bull-to-bull or bear-to-bear)
• Compares recent trend durations to historical average
• If recent trends 20%+ longer than average: +20% adjustment (trending regime detected)
• If recent trends 20%+ shorter than average: -20% adjustment (choppy regime detected)
• Detects whether market is in trending or mean-reversion mode
Three analysis modes:
SIMPLE MODE - Basic Statistics
• Uses raw median of similar trends only
• No multipliers, no adjustments
• Best for: Beginners, clean trending markets
• Fastest calculations, minimal complexity
STANDARD MODE - Full Statistical Analysis
• Similarity matching with k-nearest neighbors
• Exponential weighting of recent trends
• Median, average, and range calculations
• Best for: Most traders, general market conditions
• Balance of accuracy and simplicity
ADVANCED MODE - Statistics + Intelligence
• Everything in Standard mode PLUS
• All 5 advanced multipliers (structure, asset type, flip strength, learning, regime)
• Highest Statistical accuracy in testing
• Best for: Experienced traders, volatile/complex markets
• Maximum intelligence, most adaptive
Visual Duration Analysis Box:
When a new trend begins (SuperTrend flip), a box appears on your chart showing:
• Analysis Mode (Simple / Standard / Advanced)
• Number of historical trends analyzed
• Median expected duration (most likely outcome)
• Average expected duration (mean of similar trends)
• Range (minimum to maximum from similar trends)
• Advanced multipliers breakdown (Advanced mode only)
• Backtest accuracy statistics (if available)
The box extends from the flip bar to the estimated endpoint based on historical data, giving you a visual target for trend duration. Box updates in real-time as trend progresses.
Backtest & Accuracy Tracking:
• System backtests its own duration estimates using historical data
• Shows accuracy metrics: how well duration estimates matched actual durations
• Tracks last 10 completed duration estimates separately
• Displays statistics in dashboard and duration analysis boxes
• Helps you understand statistical reliability on your specific symbol/timeframe
Anti-Repaint Guarantee:
• duration analysis boxes only appear AFTER bar close (barstate.isconfirmed)
• Historical duration estimates never disappear or change
• What you see in history is exactly what you would have seen real-time
• No future data leakage, no lookahead bias
2. INTELLIGENT PRESET CONFIGURATIONS - One-Click Optimization
Unlike indicators that require tedious parameter tweaking, this system includes professionally optimized presets for every trading style. Select your approach from the dropdown and ALL parameters auto-configure.
"AUTO (DETECT FROM TF)" - RECOMMENDED
The smartest option: automatically selects optimal settings based on your chart timeframe.
• 1m-5m charts → Scalping preset (ATR: 7, Mult: 2.0)
• 15m-1h charts → Day Trading preset (ATR: 10, Mult: 2.5)
• 2h-4h-D charts → Swing Trading preset (ATR: 14, Mult: 3.0)
• W-M charts → Position Trading preset (ATR: 21, Mult: 4.0)
Benefits:
• Zero configuration - works immediately
• Always matched to your timeframe
• Switch timeframe = automatic adjustment
• Perfect for traders who use multiple timeframes
"SCALPING (1-5M)" - Ultra-Fast Signals
Optimized for: 1-5 minute charts, high-frequency trading, quick profits
Target holding period: Minutes to 1-2 hours maximum
Best markets: High-volume stocks, major crypto pairs, active futures
Parameter Configuration:
• Supertrend: ATR 7, Multiplier 2.0 (very sensitive)
• Volume: MA 10, High 1.8x, Spike 3.0x (catches quick surges)
• Volume Momentum: AUTO-DISABLED (too restrictive for fast scalping)
• Quality minimum: 40 points (accepts more setups)
• Duration Analysis: Uses last 15 trends with heavy recent weighting
Trading Logic:
Speed over precision. Short ATR period and low multiplier create highly responsive SuperTrend. Volume momentum filter disabled to avoid missing fast moves. Quality threshold relaxed to catch more opportunities in rapid market conditions.
Signals per session: 5-15 typically
Hold time: Minutes to couple hours
Best for: Active traders with fast execution
"DAY TRADING (15M-1H)" - Balanced Approach
Optimized for: 15-minute to 1-hour charts, intraday moves, session-based trading
Target holding period: 30 minutes to 8 hours (within trading day)
Best markets: Large-cap stocks, major indices, established crypto
Parameter Configuration:
• Supertrend: ATR 10, Multiplier 2.5 (balanced)
• Volume: MA 20, High 1.5x, Spike 2.5x (standard detection)
• Volume Momentum: 5/20 periods (confirms intraday strength)
• Quality minimum: 50 points (good setups preferred)
• Duration Analysis: Balanced weighting of recent vs historical
Trading Logic:
The most balanced configuration. ATR 10 with multiplier 2.5 provides steady trend following that avoids noise while catching meaningful moves. Volume momentum confirms institutional participation without being overly restrictive.
Signals per session: 2-5 typically
Hold time: 30 minutes to full day
Best for: Part-time and full-time active traders
"SWING TRADING (4H-D)" - Trend Stability
Optimized for: 4-hour to Daily charts, multi-day holds, trend continuation
Target holding period: 2-15 days typically
Best markets: Growth stocks, sector ETFs, trending crypto, commodity futures
Parameter Configuration:
• Supertrend: ATR 14, Multiplier 3.0 (stable)
• Volume: MA 30, High 1.3x, Spike 2.2x (accumulation focus)
• Volume Momentum: 10/30 periods (trend stability)
• Quality minimum: 60 points (high-quality setups only)
• Duration Analysis: Favors consistent historical patterns
Trading Logic:
Designed for substantial trend moves while filtering short-term noise. Higher ATR period and multiplier create stable SuperTrend that won't flip on minor corrections. Stricter quality requirements ensure only strongest setups generate signals.
Signals per week: 2-5 typically
Hold time: Days to couple weeks
Best for: Part-time traders, swing style
"POSITION TRADING (D-W)" - Long-Term Trends
Optimized for: Daily to Weekly charts, major trend changes, portfolio allocation
Target holding period: Weeks to months
Best markets: Blue-chip stocks, major indices, established cryptocurrencies
Parameter Configuration:
• Supertrend: ATR 21, Multiplier 4.0 (very stable)
• Volume: MA 50, High 1.2x, Spike 2.0x (long-term accumulation)
• Volume Momentum: 20/50 periods (major trend confirmation)
• Quality minimum: 70 points (excellent setups only)
• Duration Analysis: Heavy emphasis on multi-year historical data
Trading Logic:
Conservative approach focusing on major trend changes. Extended ATR period and high multiplier create SuperTrend that only flips on significant reversals. Very strict quality filters ensure signals represent genuine long-term opportunities.
Signals per month: 1-2 typically
Hold time: Weeks to months
Best for: Long-term investors, set-and-forget approach
"CUSTOM" - Advanced Configuration
Purpose: Complete manual control for experienced traders
Use when: You understand the parameters and want specific optimization
Best for: Testing new approaches, unusual market conditions, specific instruments
Full control over:
• All SuperTrend parameters
• Volume thresholds and momentum periods
• Quality scoring weights
• analysis mode and multipliers
• Advanced features tuning
Preset Comparison Quick Reference:
Chart Timeframe: Scalping (1M-5M) | Day Trading (15M-1H) | Swing (4H-D) | Position (D-W)
Signals Frequency: Very High | High | Medium | Low
Hold Duration: Minutes | Hours | Days | Weeks-Months
Quality Threshold: 40 pts | 50 pts | 60 pts | 70 pts
ATR Sensitivity: Highest | Medium | Lower | Lowest
Time Investment: Highest | High | Medium | Lowest
Experience Level: Expert | Advanced | Intermediate | Beginner+
3. QUALITY SCORING SYSTEM (0-70 Points)
Every signal is rated in real-time across three dimensions:
Volume Confirmation (0-30 points):
• Volume Spike (2.5x+ average): 30 points
• High Volume (1.5x+ average): 20 points
• Above Average (1.0x+ average): 10 points
• Below Average: 0 points
Volatility Assessment (0-30 points):
• Expanding ATR (1.2x+ average): 30 points
• Rising ATR (1.0-1.2x average): 15 points
• Contracting/Stable ATR: 0 points
Volume Momentum (0-10 points):
• Strong Momentum (1.2x+ ratio): 10 points
• Rising Momentum (1.0-1.2x ratio): 5 points
• Weak/Neutral Momentum: 0 points
Score Interpretation:
60-70 points - EXCELLENT:
• All factors aligned
• High conviction setup
• Maximum position size (within risk limits)
• Primary trading opportunities
45-59 points - STRONG:
• Multiple confirmations present
• Above-average setup quality
• Standard position size
• Good trading opportunities
30-44 points - GOOD:
• Basic confirmations met
• Acceptable setup quality
• Reduced position size
• Wait for additional confirmation or trade smaller
Below 30 points - WEAK:
• Minimal confirmations
• Low probability setup
• Consider passing
• Only for aggressive traders in strong trends
Only signals meeting your minimum quality threshold (configurable per preset) generate alerts and labels.
4. MULTI-TIMEFRAME CONFLUENCE ANALYSIS
The system can simultaneously analyze trend alignment across 6 timeframes (optional feature):
Timeframes analyzed:
• 5-minute (scalping context)
• 15-minute (intraday momentum)
• 1-hour (day trading bias)
• 4-hour (swing context)
• Daily (primary trend)
• Weekly (macro trend)
Confluence Interpretation:
• 5-6/6 aligned - Very strong multi-timeframe agreement (highest confidence)
• 3-4/6 aligned - Moderate agreement (standard setup)
• 1-2/6 aligned - Weak agreement (caution advised)
Dashboard shows real-time alignment count with color-coding. Higher confluence typically correlates with longer, stronger trends.
5. VOLUME MOMENTUM FILTER - Institutional Money Flow
Unlike traditional volume indicators that just measure size, Volume Momentum tracks the RATE OF CHANGE in volume:
How it works:
• Compares short-term volume average (fast period) to long-term average (slow period)
• Ratio above 1.0 = Volume accelerating (money flowing IN)
• Ratio above 1.2 = Strong acceleration (institutional participation likely)
• Ratio below 0.8 = Volume decelerating (money flowing OUT)
Why it matters:
• Confirms trend with actual money flow, not just price
• Leading indicator (volume often leads price)
• Catches accumulation/distribution before breakouts
• More intuitive than complex mathematical filters
Integration with signals:
• Optional filter - can be enabled/disabled per preset
• When enabled: Only signals with rising volume momentum fire
• AUTO-DISABLED in Scalping mode (too restrictive for fast trading)
• Configurable fast/slow periods per trading style
6. ADAPTIVE SUPERTREND MULTIPLIER
Traditional SuperTrend uses fixed ATR multiplier. This system dynamically adjusts the multiplier (0.8x to 1.2x base) based on:
• Trend Strength: Price correlation over lookback period
• Volume Weight: Current volume relative to average
Benefits:
• Tighter bands in calm markets (less premature exits)
• Wider bands in volatile conditions (avoids whipsaws)
• Better adaptation to biotech, small-cap, and crypto volatility
• Optional - can be disabled for classic constant multiplier
7. VISUAL GRADIENT RIBBON
26-layer exponential gradient fill between price and SuperTrend line provides instant visual trend strength assessment:
Color System:
• Green shades - Bullish trend + volume confirmation (strongest)
• Blue shades - Bullish trend, normal volume
• Orange shades - Bearish trend + volume confirmation
• Red shades - Bearish trend (weakest)
Opacity varies based on:
• Distance from SuperTrend (farther = more opaque)
• Volume intensity (higher volume = stronger color)
The ribbon provides at-a-glance trend strength without cluttering your chart. Can be toggled on/off.
8. INTELLIGENT ALERT SYSTEM
Two-tier alert architecture for flexibility:
Automatic Alerts:
• Fire automatically on BUY and SELL signals
• Include full context: quality score, volume state, volume momentum
• One alert per bar close (alert.freq_once_per_bar_close)
• Message format: "BUY: Supertrend bullish + Quality: 65/70 | Volume: HIGH | Vol Momentum: STRONG (1.35x)"
Customizable Alert Conditions:
• Appear in TradingView's "Create Alert" dialog
• Three options: BUY Signal Only, SELL Signal Only, ANY Signal (BUY or SELL)
• Use TradingView placeholders: {{ticker}}, {{interval}}, {{close}}, {{time}}
• Fully customizable message templates
All alerts use barstate.isconfirmed - Zero repaint guarantee.
9. ANTI-REPAINT ARCHITECTURE
Every component guaranteed non-repainting:
• Entry signals: Only appear after bar close
• duration analysis boxes: Created only on confirmed SuperTrend flips
• Informative labels: Wait for bar confirmation
• Alerts: Fire once per closed bar
• Multi-timeframe data: Uses lookahead=barmerge.lookahead_off
What you see in history is exactly what you would have seen in real-time. No disappearing signals, no changed duration estimates.
HOW TO USE THE INDICATOR
QUICK START - 3 Steps to Trading:
Step 1: Select Your Trading Style
Open indicator settings → "Quick Setup" section → Trading Style Preset dropdown
Options:
• Auto (Detect from TF) - RECOMMENDED: Automatically configures based on your chart timeframe
• Scalping (1-5m) - For 1-5 minute charts, ultra-fast signals
• Day Trading (15m-1h) - For 15m-1h charts, balanced approach
• Swing Trading (4h-D) - For 4h-Daily charts, trend stability
• Position Trading (D-W) - For Daily-Weekly charts, long-term trends
• Custom - Manual configuration (advanced users only)
Choose "Auto" and you're done - all parameters optimize automatically.
Step 2: Understand the Signals
BUY Signal (Green Triangle Below Price):
• SuperTrend flipped bullish
• Quality score meets minimum threshold (varies by preset)
• Volume confirmation present (if filter enabled)
• Volume momentum rising (if filter enabled)
• duration analysis box shows expected trend duration
SELL Signal (Red Triangle Above Price):
• SuperTrend flipped bearish
• Quality score meets minimum threshold
• Volume confirmation present (if filter enabled)
• Volume momentum rising (if filter enabled)
• duration analysis box shows expected trend duration
Duration Analysis Box:
• Appears at SuperTrend flip (start of new trend)
• Shows median, average, and range duration estimates
• Extends to estimated endpoint based on historical data visually
• Updates mode-specific intelligence (Simple/Standard/Advanced)
Step 3: Use the Dashboard for Context
Dashboard (top-right corner) shows real-time metrics:
• Row 1 - Quality Score: Current setup rating (0-70)
• Row 2 - SuperTrend: Direction and current level
• Row 3 - Volume: Status (Spike/High/Normal/Low) with color
• Row 4 - Volatility: State (Expanding/Rising/Stable/Contracting)
• Row 5 - Volume Momentum: Ratio and trend
• Row 6 - Duration Statistics: Accuracy metrics and track record
Every cell has detailed tooltip - hover for full explanations.
SIGNAL INTERPRETATION BY QUALITY SCORE:
Excellent Setup (60-70 points):
• Quality Score: 60-70
• Volume: Spike or High
• Volatility: Expanding
• Volume Momentum: Strong (1.2x+)
• MTF Confluence (if enabled): 5-6/6
• Action: Primary trade - maximum position size (within risk limits)
• Statistical reliability: Highest - duration estimates most accurate
Strong Setup (45-59 points):
• Quality Score: 45-59
• Volume: High or Above Average
• Volatility: Rising
• Volume Momentum: Rising (1.0-1.2x)
• MTF Confluence (if enabled): 3-4/6
• Action: Standard trade - normal position size
• Statistical reliability: Good - duration estimates reliable
Good Setup (30-44 points):
• Quality Score: 30-44
• Volume: Above Average
• Volatility: Stable or Rising
• Volume Momentum: Neutral to Rising
• MTF Confluence (if enabled): 3-4/6
• Action: Cautious trade - reduced position size, wait for additional confirmation
• Statistical reliability: Moderate - duration estimates less certain
Weak Setup (Below 30 points):
• Quality Score: Below 30
• Volume: Low or Normal
• Volatility: Contracting or Stable
• Volume Momentum: Weak
• MTF Confluence (if enabled): 1-2/6
• Action: Pass or wait for improvement
• Statistical reliability: Low - duration estimates unreliable
USING duration analysis boxES FOR TRADE MANAGEMENT:
Entry Timing:
• Enter on SuperTrend flip (signal bar close)
• duration analysis box appears simultaneously
• Note the median duration - this is your expected hold time
Profit Targets:
• Conservative: Use MEDIAN duration as profit target (50% probability)
• Moderate: Use AVERAGE duration (mean of similar trends)
• Aggressive: Aim for MAX duration from range (best historical outcome)
Position Management:
• Scale out at median duration (take partial profits)
• Trail stop as trend extends beyond median
• Full exit at average duration or SuperTrend flip (whichever comes first)
• Re-evaluate if trend exceeds estimated range
analysis mode Selection:
• Simple: Clean trending markets, beginners, minimal complexity
• Standard: Most markets, most traders (recommended default)
• Advanced: Volatile markets, complex instruments, experienced traders seeking highest accuracy
Asset Type Configuration (Advanced Mode):
If using Advanced analysis mode, configure Asset Type for optimal accuracy:
• Small Cap: Stocks under $2B market cap, low liquidity
• Biotech / Speculative: Clinical-stage pharma, penny stocks, high-risk
• Blue Chip / Large Cap: S&P 500, mega-cap tech, stable large companies
• Tech Growth: High-growth tech (TSLA, NVDA, growth SaaS)
• Dividend / Value: Dividend aristocrats, value stocks, utilities
• Cyclical: Energy, materials, industrials (macro-driven)
• Crypto / High Volatility: Bitcoin, altcoins, highly volatile assets
Correct asset type selection improves Statistical accuracy by 15-20%.
RISK MANAGEMENT GUIDELINES:
1. Stop Loss Placement:
Long positions:
• Place stop below recent swing low OR
• Place stop below SuperTrend level (whichever is tighter)
• Use 1-2 ATR distance as guideline
• Recommended: SuperTrend level (built-in volatility adjustment)
Short positions:
• Place stop above recent swing high OR
• Place stop above SuperTrend level (whichever is tighter)
• Use 1-2 ATR distance as guideline
• Recommended: SuperTrend level
2. Position Sizing by Quality Score:
• Excellent (60-70): Maximum position size (2% risk per trade)
• Strong (45-59): Standard position size (1.5% risk per trade)
• Good (30-44): Reduced position size (1% risk per trade)
• Weak (Below 30): Pass or micro position (0.5% risk - learning trades only)
3. Exit Strategy Options:
Option A - Statistical Duration-Based Exit:
• Exit at median estimated duration (conservative)
• Exit at average estimated duration (moderate)
• Trail stop beyond average duration (aggressive)
Option B - Signal-Based Exit:
• Exit on opposite signal (SELL after BUY, or vice versa)
• Exit on SuperTrend flip (trend reversal)
• Exit if quality score drops below 30 mid-trend
Option C - Hybrid (Recommended):
• Take 50% profit at median estimated duration
• Trail stop on remaining 50% using SuperTrend as trailing level
• Full exit on SuperTrend flip or quality collapse
4. Trade Filtering:
For higher win-rate (fewer trades, better quality):
• Increase minimum quality score (try 60 for swing, 50 for day trading)
• Enable volume momentum filter (ensure institutional participation)
• Require higher MTF confluence (5-6/6 alignment)
• Use Advanced analysis mode with appropriate asset type
For more opportunities (more trades, lower quality threshold):
• Decrease minimum quality score (40 for day trading, 35 for scalping)
• Disable volume momentum filter
• Lower MTF confluence requirement
• Use Simple or Standard analysis mode
SETTINGS OVERVIEW
Quick Setup Section:
• Trading Style Preset: Auto / Scalping / Day Trading / Swing / Position / Custom
Dashboard & Display:
• Show Dashboard (ON/OFF)
• Dashboard Position (9 options: Top/Middle/Bottom + Left/Center/Right)
• Text Size (Auto/Tiny/Small/Normal/Large/Huge)
• Show Ribbon Fill (ON/OFF)
• Show SuperTrend Line (ON/OFF)
• Bullish Color (default: Green)
• Bearish Color (default: Red)
• Show Entry Labels - BUY/SELL signals (ON/OFF)
• Show Info Labels - Volume events (ON/OFF)
• Label Size (Auto/Tiny/Small/Normal/Large/Huge)
Supertrend Configuration:
• ATR Length (default varies by preset: 7-21)
• ATR Multiplier Base (default varies by preset: 2.0-4.0)
• Use Adaptive Multiplier (ON/OFF) - Dynamic 0.8x-1.2x adjustment
• Smoothing Factor (0.0-0.5) - EMA smoothing applied to bands
• Neutral Bars After Flip (0-10) - Hide ST immediately after flip
Volume Momentum:
• Enable Volume Momentum Filter (ON/OFF)
• Fast Period (default varies by preset: 3-20)
• Slow Period (default varies by preset: 10-50)
Volume Analysis:
• Volume MA Length (default varies by preset: 10-50)
• High Volume Threshold (default: 1.5x)
• Spike Threshold (default: 2.5x)
• Low Volume Threshold (default: 0.7x)
Quality Filters:
• Minimum Quality Score (0-70, varies by preset)
• Require Volume Confirmation (ON/OFF)
Trend Duration Analysis:
• Show Duration Analysis (ON/OFF) - Display duration analysis boxes
• analysis mode - Simple / Standard / Advanced
• Asset Type - 7 options (Small Cap, Biotech, Blue Chip, Tech Growth, Dividend, Cyclical, Crypto)
• Use Exponential Weighting (ON/OFF) - Recent trends weighted more
• Decay Factor (0.5-0.99) - How much more recent trends matter
• Structure Lookback (3-30) - Pivot detection period for support/resistance
• Proximity Threshold (xATR) - How close to level qualifies as "near"
• Enable Error Learning (ON/OFF) - System learns from estimation errors
• Memory Depth (3-20) - How many past errors to remember
Box Visual Settings:
• duration analysis box Border Color
• duration analysis box Background Color
• duration analysis box Text Color
• duration analysis box Border Width
• duration analysis box Transparency
Multi-Timeframe (Optional Feature):
• Enable MTF Confluence (ON/OFF)
• Minimum Alignment Required (0-6)
• Individual timeframe enable/disable toggles
• Custom timeframe selection options
All preset configurations override manual inputs except when "Custom" is selected.
ADVANCED FEATURES
1. Scalpel Mode (Optional)
Advanced pullback entry system that waits for healthy retracements within established trends before signaling entry:
• Monitors price distance from SuperTrend levels
• Requires pullback to configurable range (default: 30-50%)
• Ensures trend remains intact before entry signal
• Reduces whipsaw and false breakouts
• Inspired by Mark Minervini's VCP pullback entries
Best for: Swing traders and day traders seeking precision entries
Scalpers: Consider disabling for faster entries
2. Error Learning System (Advanced analysis mode Only)
The system learns from its own estimation errors:
• Tracks last 10-20 completed duration estimates (configurable memory depth)
• Calculates error ratio for each: estimated duration / Actual Duration
• If system consistently over-estimates: Applies negative correction (-15%)
• If system consistently under-estimates: Applies positive correction (+15%)
• Adapts to current market regime automatically
This self-correction mechanism improves accuracy over time as the system gathers more data on your specific symbol and timeframe.
3. Regime Detection (Advanced analysis mode Only)
Automatically detects whether market is in trending or choppy regime:
• Compares last 3 trends to historical average
• Recent trends 20%+ longer → Trending regime (+20% to estimates)
• Recent trends 20%+ shorter → Choppy regime (-20% to estimates)
• Applied separately to bullish and bearish trends
Helps duration estimates adapt to changing market conditions without manual intervention.
4. Exponential Weighting
Option to weight recent trends more heavily than distant history:
• Default decay factor: 0.9
• Recent trends get higher weight in statistical calculations
• Older trends gradually decay in importance
• Rationale: Recent market behavior more relevant than old data
• Can be disabled for equal weighting
5. Backtest Statistics
System backtests its own duration estimates using historical data:
• Walks through past trends chronologically
• Calculates what duration estimate WOULD have been at each flip
• Compares to actual duration that occurred
• Displays accuracy metrics in duration analysis boxes and dashboard
• Helps assess statistical reliability on your specific chart
Note: Backtest uses only data available AT THE TIME of each historical flip (no lookahead bias).
TECHNICAL SPECIFICATIONS
• Pine Script Version: v6
• Indicator Type: Overlay (draws on price chart)
• Max Boxes: 500 (for duration analysis box storage)
• Max Bars Back: 5000 (for comprehensive historical analysis)
• Security Calls: 1 (for MTF if enabled - optimized)
• Repainting: NO - All signals and duration estimates confirmed on bar close
• Lookahead Bias: NO - All HTF data properly offset, all duration estimates use only historical data
• Real-time Updates: YES - Dashboard and quality scores update live
• Alert Capable: YES - Both automatic alerts and customizable alert conditions
• Multi-Symbol: Works on stocks, crypto, forex, futures, indices
Performance Optimization:
• Conditional calculations (duration analysis can be disabled to reduce load)
• Efficient array management (circular buffers for trend storage)
• Streamlined gradient rendering (26 layers, can be toggled off)
• Smart label cooldown system (prevents label spam)
• Optimized similarity matching (analyzes only relevant trends)
Data Requirements:
• Minimum 50-100 bars for initial duration analysis (builds historical database)
• Optimal: 500+ bars for robust statistical analysis
• Longer history = more accurate duration estimates
• Works on any timeframe from 1 minute to monthly
KNOWN LIMITATIONS
• Trending Markets Only: Performs best in clear trends. May generate false signals in choppy/sideways markets (use quality score filtering and regime detection to mitigate)
• Lagging Nature: Like all trend-following systems, signals occur AFTER trend establishment, not at exact tops/bottoms. Use duration analysis boxes to set realistic profit targets.
• Initial Learning Period: Duration analysis system requires 10-15 completed trends to build reliable historical database. Early duration estimates less accurate (first few weeks on new symbol/timeframe).
• Visual Load: 26-layer gradient ribbon may slow performance on older devices. Disable ribbon if experiencing lag.
• Statistical accuracy Variables: Duration estimates are statistical estimates, not guarantees. Accuracy varies by:
- Market regime (trending vs choppy)
- Asset volatility characteristics
- Quality of historical pattern matches
- Timeframe traded (higher TF = more reliable)
• Not Best Suitable For:
- Ultra-short-term scalping (sub-1-minute charts)
- Mean-reversion strategies (designed for trend-following)
- Range-bound trading (requires trending conditions)
- News-driven spikes (estimates based on technical patterns, not fundamentals)
FREQUENTLY ASKED QUESTIONS
Q: Does this indicator repaint?
A: Absolutely not. All signals, duration analysis boxes, labels, and alerts use barstate.isconfirmed checks. They only appear after the bar closes. What you see in history is exactly what you would have seen in real-time. Zero repaint guarantee.
Q: How accurate are the trend duration estimates?
A: Accuracy varies by mode, market conditions, and historical data quality:
• Simple mode: 60-70% accuracy (within ±20% of actual duration)
• Standard mode: 70-80% accuracy (within ±20% of actual duration)
• Advanced mode: 75-85% accuracy (within ±20% of actual duration)
Best accuracy achieved on:
• Higher timeframes (4H, Daily, Weekly)
• Trending markets (not choppy/sideways)
• Assets with consistent behavior (Blue Chip, Large Cap)
• After 20+ historical trends analyzed (builds robust database)
Remember: All duration estimates are statistical calculations based on historical patterns, not guarantees.
Q: Which analysis mode should I use?
A:
• Simple: Beginners, clean trending markets, want minimal complexity
• Standard: Most traders, general market conditions (RECOMMENDED DEFAULT)
• Advanced: Experienced traders, volatile/complex markets (biotech, small-cap, crypto), seeking maximum accuracy
Advanced mode requires correct Asset Type configuration for optimal results.
Q: What's the difference between the trading style presets?
A: Each preset optimizes ALL parameters for a specific trading approach:
• Scalping: Ultra-sensitive (ATR 7, Mult 2.0), more signals, shorter holds
• Day Trading: Balanced (ATR 10, Mult 2.5), moderate signals, intraday holds
• Swing Trading: Stable (ATR 14, Mult 3.0), fewer signals, multi-day holds
• Position Trading: Very stable (ATR 21, Mult 4.0), rare signals, week/month holds
Auto mode automatically selects based on your chart timeframe.
Q: Should I use Auto mode or manually select a preset?
A: Auto mode is recommended for most traders. It automatically matches settings to your timeframe and re-optimizes if you switch charts. Only use manual preset selection if:
• You want scalping settings on a 15m chart (overriding auto-detection)
• You want swing settings on a 1h chart (more conservative than auto would give)
• You're testing different approaches on same timeframe
Q: Can I use this for scalping and day trading?
A: Absolutely! The preset system is specifically designed for all trading styles:
• Select "Scalping (1-5m)" for 1-5 minute charts
• Select "Day Trading (15m-1h)" for 15m-1h charts
• Or use "Auto" mode and it configures automatically
Volume momentum filter is auto-disabled in Scalping mode for faster signals.
Q: What is Volume Momentum and why does it matter?
A: Volume Momentum compares short-term volume (fast MA) to long-term volume (slow MA). It answers: "Is money flowing into this asset faster now than historically?"
Why it matters:
• Volume often leads price (early warning system)
• Confirms institutional participation (smart money)
• No lag like price-based indicators
• More intuitive than complex mathematical filters
When the ratio is above 1.2, you have strong evidence that institutions are accumulating (bullish) or distributing (bearish).
Q: How do I set up alerts?
A: Two options:
Option 1 - Automatic Alerts:
1. Right-click on chart → Add Alert
2. Condition: Select this indicator
3. Choose "Any alert() function call"
4. Configure notification method (app, email, webhook)
5. You'll receive detailed alerts on every BUY and SELL signal
Option 2 - Customizable Alert Conditions:
1. Right-click on chart → Add Alert
2. Condition: Select this indicator
3. You'll see three options in dropdown:
- "BUY Signal" (long signals only)
- "SELL Signal" (short signals only)
- "ANY Signal" (both BUY and SELL)
4. Choose desired option and customize message template
5. Uses TradingView placeholders: {{ticker}}, {{close}}, {{time}}, etc.
All alerts fire only on confirmed bar close (no repaint).
Q: What is Scalpel Mode and should I use it?
A: Scalpel Mode waits for healthy pullbacks within established trends before signaling entry. It reduces whipsaws and improves entry timing.
Recommended ON for:
• Swing traders (want precision entries on pullbacks)
• Day traders (willing to wait for better prices)
• Risk-averse traders (prefer fewer but higher-quality entries)
Recommended OFF for:
• Scalpers (need immediate entries, can't wait for pullbacks)
• Momentum traders (want to enter on breakout, not pullback)
• Aggressive traders (prefer more opportunities over precision)
Q: Why do some duration estimates show wider ranges than others?
A: Range width reflects historical trend variability:
• Narrow range: Similar historical trends had consistent durations (high confidence)
• Wide range: Similar historical trends had varying durations (lower confidence)
Wide ranges often occur:
• Early in analysis (fewer historical trends to learn from)
• In volatile/choppy markets (inconsistent trend behavior)
• On lower timeframes (more noise, less consistency)
The median and average still provide useful targets even when range is wide.
Q: Can I customize the dashboard position and appearance?
A: Yes! Dashboard settings include:
• Position: 9 options (Top/Middle/Bottom + Left/Center/Right)
• Text Size: Auto, Tiny, Small, Normal, Large, Huge
• Show/Hide: Toggle entire dashboard on/off
Choose position that doesn't overlap important price action on your specific chart.
Q: Which timeframe should I trade on?
A: Depends on your trading style and time availability:
• 1-5 minute: Active scalping, requires constant monitoring
• 15m-1h: Day trading, check few times per session
• 4h-Daily: Swing trading, check once or twice daily
• Daily-Weekly: Position trading, check weekly
General principle: Higher timeframes produce:
• Fewer signals (less frequent)
• Higher quality setups (stronger confirmations)
• More reliable duration estimates (better statistical data)
• Less noise (clearer trends)
Start with Daily chart if new to trading. Move to lower timeframes as you gain experience.
Q: Does this work on all markets (stocks, crypto, forex)?
A: Yes, it works on all markets with trending characteristics:
Excellent for:
• Stocks (especially growth and momentum names)
• Crypto (BTC, ETH, major altcoins)
• Futures (indices, commodities)
• Forex majors (EUR/USD, GBP/USD, etc.)
Best results on:
• Trending markets (not range-bound)
• Liquid instruments (tight spreads, good fills)
• Volatile assets (clear trend development)
Less effective on:
• Range-bound/sideways markets
• Ultra-low volatility instruments
• Illiquid small-caps (use caution)
Configure Asset Type (in Advanced analysis mode) to match your instrument for best accuracy.
Q: How many signals should I expect per day/week?
A: Highly variable based on:
By Timeframe:
• 1-5 minute: 5-15 signals per session
• 15m-1h: 2-5 signals per day
• 4h-Daily: 2-5 signals per week
• Daily-Weekly: 1-2 signals per month
By Market Volatility:
• High volatility = more SuperTrend flips = more signals
• Low volatility = fewer flips = fewer signals
By Quality Filter:
• Higher threshold (60-70) = fewer but better signals
• Lower threshold (30-40) = more signals, lower quality
By Volume Momentum Filter:
• Enabled = Fewer signals (only volume-confirmed)
• Disabled = More signals (all SuperTrend flips)
Adjust quality threshold and filters to match your desired signal frequency.
Q: What's the difference between entry labels and info labels?
A:
Entry Labels (BUY/SELL):
• Your primary trading signals
• Based on SuperTrend flip + all confirmations (quality, volume, momentum)
• Include quality score and confirmation icons
• These are actionable entry points
Info Labels (Volume Spike):
• Additional market context
• Show volume events that may support or contradict trend
• 8-bar cooldown to prevent spam
• NOT necessarily entry points - contextual information only
Control separately: Can show entry labels without info labels (recommended for clean charts).
Q: Can I combine this with other indicators?
A: Absolutely! This works well with:
• RSI: For divergences and overbought/oversold conditions
• Support/Resistance: Confluence with key levels
• Fibonacci Retracements: Pullback targets in Scalpel Mode
• Price Action Patterns: Flags, pennants, cup-and-handle
• MACD: Additional momentum confirmation
• Bollinger Bands: Volatility context
This indicator provides trend direction and duration estimates - complement with other tools for entry refinement and additional confluence.
Q: Why did I get a low-quality signal? Can I filter them out?
A: Yes! Increase the Minimum Quality Score in settings.
If you're seeing signals with quality below your preference:
• Day Trading: Set minimum to 50
• Swing Trading: Set minimum to 60
• Position Trading: Set minimum to 70
Only signals meeting the threshold will appear. This reduces frequency but improves win-rate.
Q: How do I interpret the MTF Confluence count?
A: Shows how many of 6 timeframes agree with current trend:
• 6/6 aligned: Perfect agreement (extremely rare, highest confidence)
• 5/6 aligned: Very strong alignment (high confidence)
• 4/6 aligned: Good alignment (standard quality setup)
• 3/6 aligned: Moderate alignment (acceptable)
• 2/6 aligned: Weak alignment (caution)
• 1/6 aligned: Very weak (likely counter-trend)
Higher confluence typically correlates with longer, stronger trends. However, MTF analysis is optional - you can disable it and rely solely on quality scoring.
Q: Is this suitable for beginners?
A: Yes, but requires foundational knowledge:
You should understand:
• Basic trend-following concepts (higher highs, higher lows)
• Risk management principles (position sizing, stop losses)
• How to read candlestick charts
• What volume and volatility mean
Beginner-friendly features:
• Auto preset mode (zero configuration)
• Quality scoring (tells you signal strength)
• Dashboard tooltips (hover for explanations)
• duration analysis boxes (visual profit targets)
Recommended for beginners:
1. Start with "Auto" or "Swing Trading" preset on Daily chart
2. Use Standard Analysis Mode (not Advanced)
3. Set minimum quality to 60 (fewer but better signals)
4. Paper trade first for 2-4 weeks
5. Study methodology references (Minervini, O'Neil, Zanger)
Q: What is the Asset Type setting and why does it matter?
A: Asset Type (in Advanced analysis mode) adjusts duration estimates based on volatility characteristics:
• Small Cap: Explosive moves, extended trends (+30-40%)
• Biotech / Speculative: Parabolic potential, news-driven (+40%)
• Blue Chip / Large Cap: Baseline, steady trends (0% adjustment)
• Tech Growth: Momentum-driven, longer trends (+20%)
• Dividend / Value: Slower, grinding trends (-20%)
• Cyclical: Macro-driven, variable (±10%)
• Crypto / High Volatility: Parabolic potential (+30%)
Correct configuration improves Statistical accuracy by 15-20%. Using Blue Chip settings on a biotech stock may underestimate trend length (you'll exit too early).
Q: Can I backtest this indicator?
A: Yes! TradingView's Strategy Tester works with this indicator's signals.
To backtest:
1. Note the entry conditions (SuperTrend flip + quality threshold + filters)
2. Create a strategy script using same logic
3. Run Strategy Tester on historical data
Additionally, the indicator includes BUILT-IN duration estimate validation:
• System backtests its own duration estimates
• Shows accuracy metrics in dashboard and duration analysis boxes
• Helps assess reliability on your specific symbol/timeframe
Q: Why does Volume Momentum auto-disable in Scalping mode?
A: Scalping requires ultra-fast entries to catch quick moves. Volume Momentum filter adds friction by requiring volume confirmation before signaling, which can cause missed opportunities in rapid scalping.
Scalping preset is optimized for speed and frequency - the filter is counterproductive for that style. It remains enabled for Day Trading, Swing Trading, and Position Trading presets where patience improves results.
You can manually enable it in Custom mode if desired.
Q: How much historical data do I need for accurate duration estimates?
A:
Minimum: 50-100 bars (indicator will function but duration estimates less reliable)
Recommended: 500+ bars (robust statistical database)
Optimal: 1000+ bars (maximum Statistical accuracy)
More history = more completed trends = better pattern matching = more accurate duration estimates.
New symbols or newly-switched timeframes will have lower Statistical accuracy initially. Allow 2-4 weeks for the system to build historical database.
IMPORTANT DISCLAIMERS
No Guarantee of Profit:
This indicator is an educational tool and does not guarantee any specific trading results. All trading involves substantial risk of loss. Duration estimates are statistical calculations based on historical patterns and are not guarantees of future performance.
Past Performance:
Historical backtest results and Statistical accuracy statistics do not guarantee future performance. Market conditions change constantly. What worked historically may not work in current or future markets.
Not Financial Advice:
This indicator provides technical analysis signals and statistical duration estimates only. It is not financial, investment, or trading advice. Always consult with a qualified financial advisor before making investment decisions.
Risk Warning:
Trading stocks, options, futures, forex, and cryptocurrencies involves significant risk. You can lose all of your invested capital. Never trade with money you cannot afford to lose. Only risk capital you can lose without affecting your lifestyle.
Testing Required:
Always test this indicator on a demo account or with paper trading before risking real capital. Understand how it works in different market conditions. Verify Statistical accuracy on your specific instruments and timeframes before trusting it with real money.
User Responsibility:
You are solely responsible for your trading decisions. The developer assumes no liability for trading losses, incorrect duration estimates, software errors, or any other damages incurred while using this indicator.
Statistical Estimation Limitations:
Trend Duration estimates are statistical estimates based on historical pattern matching. They are NOT guarantees. Actual trend durations may differ significantly from duration estimates due to unforeseen news events, market regime changes, or lack of historical precedent for current conditions.
CREDITS & ACKNOWLEDGMENTS
Methodology Inspiration:
• Mark Minervini - Volatility Contraction Pattern (VCP) concepts and pullback entry techniques
• William O'Neil - Volume analysis principles and CANSLIM institutional buying patterns
• Dan Zanger - Momentum breakout strategies and volatility expansion entries
Technical Components:
• SuperTrend calculation - Classic ATR-based trend indicator (public domain)
• Statistical analysis - Standard median, average, range calculations
• k-Nearest Neighbors - Classic machine learning similarity matching concept
• Multi-timeframe analysis - Standard request.security implementation in Pine Script
For questions, feedback, or support, please comment below or send a private message.
Happy Trading!

NeuraEdge ORB Professional Opening Range Breakout Indicator-15m🚀 NeuraEdge ORB - Professional Opening Range Breakout Indicator
We're excited to release this clean, effective Opening Range Breakout (ORB) indicator for the trading community. The 15-minute ORB is one of the most time-tested intraday strategies, and we've built this tool to make it simple and actionable.
━━━━━━━━━━━━━━━━━━━━━━━━━━━━━━━━━━━━━━━━━━━━━━━━━━━━
📖 WHAT IS THE 15-MINUTE ORB STRATEGY?
The Opening Range Breakout strategy captures the initial price range established in the first 15 minutes of market open (9:30-9:45 AM ET). This range often sets the tone for the trading day, as institutional order flow and overnight gap reactions play out during this window.
The concept is simple:
- Mark the HIGH and LOW of the first 15 minutes
- Trade the breakout when price breaks above or below this range
- Use the opposite side of the range as your stop loss
━━━━━━━━━━━━━━━━━━━━━━━━━━━━━━━━━━━━━━━━━━━━━━━━━━━━
⚙️ HOW TO USE THIS INDICATOR
1️⃣ SETUP
• Apply to SPY, QQQ, IWM, or any liquid stock/ETF
• Recommended timeframes: 1-minute or 5-minute charts
• The indicator automatically detects the 9:30-9:45 AM ET session
2️⃣ WAIT FOR THE RANGE
• A blue box will form showing the Opening Range
• Wait for the 15-minute period to complete (marked "✅ COMPLETE" in dashboard)
• Note the range size - larger ranges often mean stronger moves
3️⃣ TRADE THE BREAKOUT
• 🟢 LONG: When price closes above the Opening Range High
• 🔴 SHORT: When price closes below the Opening Range Low
• Signals appear automatically with entry, stop loss (SL), and take profit (TP) levels
4️⃣ MANAGE YOUR TRADE
• Stop Loss: Placed at opposite side of range (default) or midpoint
• Take Profit: Based on your selected Risk:Reward ratio
• The indicator tracks win rate automatically
━━━━━━━━━━━━━━━━━━━━━━━━━━━━━━━━━━━━━━━━━━━━━━━━━━━━
🎯 ENTRY TYPES
BREAKOUT MODE (Default)
- Enters immediately when price breaks the range
- More signals, catches the initial move
- Best for: Trending days, high momentum
RETEST MODE
- Waits for price to break out, then pull back to the range
- Fewer signals, better entry price
- Best for: Choppy days, tighter stops
━━━━━━━━━━━━━━━━━━━━━━━━━━━━━━━━━━━━━━━━━━━━━━━━━━━━
📊 SETTINGS EXPLAINED
Display Settings:
- Show Signals - Toggle buy/sell signals
- Show Opening Range Box - Visual box around the 15-min range
- Show Dashboard - Information panel with status and stats
Opening Range Settings:
- Opening Range Minutes - Default 15, adjustable 5-60
- Stop Trading After - Prevents late-day trades (default 3PM ET)
Entry Settings:
- Entry Type - Breakout or Retest
- Require Volume Confirmation - Only signals on above-average volume
- Require FVG Confluence - Adds Fair Value Gap filter for extra confirmation
Risk Management:
- Stop Loss Placement - Opposite Side / Midpoint / ATR Based
- Risk:Reward Ratio - Set your target (1.5 recommended)
━━━━━━━━━━━━━━━━━━━━━━━━━━━━━━━━━━━━━━━━━━━━━━━━━━━━
💡 TIPS FOR BEST RESULTS
✅ DO:
- Trade liquid instruments (SPY, QQQ, major stocks)
- Use 1-5 minute charts for better entry precision
- Respect the stop loss - the range defines your risk
- Pay attention to range size (0.5-1.5x ATR is ideal)
- Be patient - only 1-2 setups per day
❌ AVOID:
- Trading both directions on the same day
- Taking trades after 2-3 PM ET
- Very small ranges (likely to get chopped out)
- Low volume breakouts (often fail)
━━━━━━━━━━━━━━━━━━━━━━━━━━━━━━━━━━━━━━━━━━━━━━━━━━━━
📈 DASHBOARD INFORMATION
The dashboard shows:
- OR Status - Forming / Complete / Waiting
- OR High/Low - The range levels
- Range Size - In points and ATR multiples
- Breakout Direction - Long / Short / None
- Volume Status - High or Normal
- Win Rate - Tracked automatically
- W/L Record - Wins and losses count
━━━━━━━━━━━━━━━━━━━━━━━━━━━━━━━━━━━━━━━━━━━━━━━━━━━━
🔔 ALERTS INCLUDED
- Opening Range Complete - Notifies when the 15-min range is set
- ORB Long Signal - Buy signal triggered
- ORB Short Signal - Sell signal triggered
- Breakout Up/Down - Range broken (even without signal)
━━━━━━━━━━━━━━━━━━━━━━━━━━━━━━━━━━━━━━━━━━━━━━━━━━━━
⚠️ DISCLAIMER
This indicator is for educational and informational purposes only. Past performance does not guarantee future results. Always use proper risk management and never risk more than you can afford to lose. This is not financial advice.
━━━━━━━━━━━━━━━━━━━━━━━━━━━━━━━━━━━━━━━━━━━━━━━━━━━━
━━━━━━━━━━━━━━━━━━━━━━━━━━━━━━━━━━━━━━━━━━━━━━━━━━━━
We hope you find this indicator valuable in your trading journey!
💬 Questions or feedback? Leave a comment below.
🌐 Check out our full Indicator Suite: www.neura-edge.com
📧 Support: support@neura-edge.com
Happy Trading!

Algorithm Predator - ML-liteAlgorithm Predator - ML-lite
This indicator combines four specialized trading agents with an adaptive multi-armed bandit selection system to identify high-probability trade setups. It is designed for swing and intraday traders who want systematic signal generation based on institutional order flow patterns , momentum exhaustion , liquidity dynamics , and statistical mean reversion .
Core Architecture
Why These Components Are Combined:
The script addresses a fundamental challenge in algorithmic trading: no single detection method works consistently across all market conditions. By deploying four independent agents and using reinforcement learning algorithms to select or blend their outputs, the system adapts to changing market regimes without manual intervention.
The Four Trading Agents
1. Spoofing Detector Agent 🎭
Detects iceberg orders through persistent volume at similar price levels over 5 bars
Identifies spoofing patterns via asymmetric wick analysis (wicks exceeding 60% of bar range with volume >1.8× average)
Monitors order clustering using simplified Hawkes process intensity tracking (exponential decay model)
Signal Logic: Contrarian—fades false breakouts caused by institutional manipulation
Best Markets: Consolidations, institutional trading windows, low-liquidity hours
2. Exhaustion Detector Agent ⚡
Calculates RSI divergence between price movement and momentum indicator over 5-bar window
Detects VWAP exhaustion (price at 2σ bands with declining volume)
Uses VPIN reversals (volume-based toxic flow dissipation) to identify momentum failure
Signal Logic: Counter-trend—enters when momentum extreme shows weakness
Best Markets: Trending markets reaching climax points, over-extended moves
3. Liquidity Void Detector Agent 💧
Measures Bollinger Band squeeze (width <60% of 50-period average)
Identifies stop hunts via 20-bar high/low penetration with immediate reversal and volume spike
Detects hidden liquidity absorption (volume >2× average with range <0.3× ATR)
Signal Logic: Breakout anticipation—enters after liquidity grab but before main move
Best Markets: Range-bound pre-breakout, volatility compression zones
4. Mean Reversion Agent 📊
Calculates price z-scores relative to 50-period SMA and standard deviation (triggers at ±2σ)
Implements Ornstein-Uhlenbeck process scoring (mean-reverting stochastic model)
Uses entropy analysis to detect algorithmic trading patterns (low entropy <0.25 = high predictability)
Signal Logic: Statistical reversion—enters when price deviates significantly from statistical equilibrium
Best Markets: Range-bound, low-volatility, algorithmically-dominated instruments
Adaptive Selection: Multi-Armed Bandit System
The script implements four reinforcement learning algorithms to dynamically select or blend agents based on performance:
Thompson Sampling (Default - Recommended):
Uses Bayesian inference with beta distributions (tracks alpha/beta parameters per agent)
Balances exploration (trying underused agents) vs. exploitation (using proven winners)
Each agent's win/loss history informs its selection probability
Lite Approximation: Uses pseudo-random sampling from price/volume noise instead of true random number generation
UCB1 (Upper Confidence Bound):
Calculates confidence intervals using: average_reward + sqrt(2 × ln(total_pulls) / agent_pulls)
Deterministic algorithm favoring agents with high uncertainty (potential upside)
More conservative than Thompson Sampling
Epsilon-Greedy:
Exploits best-performing agent (1-ε)% of the time
Explores randomly ε% of the time (default 10%, configurable 1-50%)
Simple, transparent, easily tuned via epsilon parameter
Gradient Bandit:
Uses softmax probability distribution over agent preference weights
Updates weights via gradient ascent based on rewards
Best for Blend mode where all agents contribute
Selection Modes:
Switch Mode: Uses only the selected agent's signal (clean, decisive)
Blend Mode: Combines all agents using exponentially weighted confidence scores controlled by temperature parameter (smooth, diversified)
Lock Agent Feature:
Optional manual override to force one specific agent
Useful after identifying which agent dominates your specific instrument
Only applies in Switch mode
Four choices: Spoofing Detector, Exhaustion Detector, Liquidity Void, Mean Reversion
Memory System
Dual-Layer Architecture:
Short-Term Memory: Stores last 20 trade outcomes per agent (configurable 10-50)
Long-Term Memory: Stores episode averages when short-term reaches transfer threshold (configurable 5-20 bars)
Memory Boost Mechanism: Recent performance modulates agent scores by up to ±20%
Episode Transfer: When an agent accumulates sufficient results, averages are condensed into long-term storage
Persistence: Manual restoration of learned parameters via input fields (alpha, beta, weights, microstructure thresholds)
How Memory Works:
Agent generates signal → outcome tracked after 8 bars (performance horizon)
Result stored in short-term memory (win = 1.0, loss = 0.0)
Short-term average influences agent's future scores (positive feedback loop)
After threshold met (default 10 results), episode averaged into long-term storage
Long-term patterns (weighted 30%) + short-term patterns (weighted 70%) = total memory boost
Market Microstructure Analysis
These advanced metrics quantify institutional order flow dynamics:
Order Flow Toxicity (Simplified VPIN):
Measures buy/sell volume imbalance over 20 bars: |buy_vol - sell_vol| / (buy_vol + sell_vol)
Detects informed trading activity (institutional players with non-public information)
Values >0.4 indicate "toxic flow" (informed traders active)
Lite Approximation: Uses simple open/close heuristic instead of tick-by-tick trade classification
Price Impact Analysis (Simplified Kyle's Lambda):
Measures market impact efficiency: |price_change_10| / sqrt(volume_sum_10)
Low values = large orders with minimal price impact ( stealth accumulation )
High values = retail-dominated moves with high slippage
Lite Approximation: Uses simplified denominator instead of regression-based signed order flow
Market Randomness (Entropy Analysis):
Counts unique price changes over 20 bars / 20
Measures market predictability
High entropy (>0.6) = human-driven, chaotic price action
Low entropy (<0.25) = algorithmic trading dominance (predictable patterns)
Lite Approximation: Simple ratio instead of true Shannon entropy H(X) = -Σ p(x)·log₂(p(x))
Order Clustering (Simplified Hawkes Process):
Tracks self-exciting event intensity (coordinated order activity)
Decays at 0.9× per bar, spikes +1.0 when volume >1.5× average
High intensity (>0.7) indicates clustering (potential spoofing/accumulation)
Lite Approximation: Simple exponential decay instead of full λ(t) = μ + Σ α·exp(-β(t-tᵢ)) with MLE
Signal Generation Process
Multi-Stage Validation:
Stage 1: Agent Scoring
Each agent calculates internal score based on its detection criteria
Scores must exceed agent-specific threshold (adjusted by sensitivity multiplier)
Agent outputs: Signal direction (+1/-1/0) and Confidence level (0.0-1.0)
Stage 2: Memory Boost
Agent scores multiplied by memory boost factor (0.8-1.2 based on recent performance)
Successful agents get amplified, failing agents get dampened
Stage 3: Bandit Selection/Blending
If Adaptive Mode ON:
Switch: Bandit selects single best agent, uses only its signal
Blend: All agents combined using softmax-weighted confidence scores
If Adaptive Mode OFF:
Traditional consensus voting with confidence-squared weighting
Signal fires when consensus exceeds threshold (default 70%)
Stage 4: Confirmation Filter
Raw signal must repeat for consecutive bars (default 3, configurable 2-4)
Minimum confidence threshold: 0.25 (25%) enforced regardless of mode
Trend alignment check: Long signals require trend_score ≥ -2, Short signals require trend_score ≤ 2
Stage 5: Cooldown Enforcement
Minimum bars between signals (default 10, configurable 5-15)
Prevents over-trading during choppy conditions
Stage 6: Performance Tracking
After 8 bars (performance horizon), signal outcome evaluated
Win = price moved in signal direction, Loss = price moved against
Results fed back into memory and bandit statistics
Trading Modes (Presets)
Pre-configured parameter sets:
Conservative: 85% consensus, 4 confirmations, 15-bar cooldown
Expected: 60-70% win rate, 3-8 signals/week
Best for: Swing trading, capital preservation, beginners
Balanced: 70% consensus, 3 confirmations, 10-bar cooldown
Expected: 55-65% win rate, 8-15 signals/week
Best for: Day trading, most traders, general use
Aggressive: 60% consensus, 2 confirmations, 5-bar cooldown
Expected: 50-58% win rate, 15-30 signals/week
Best for: Scalping, high-frequency trading, active management
Elite: 75% consensus, 3 confirmations, 12-bar cooldown
Expected: 58-68% win rate, 5-12 signals/week
Best for: Selective trading, high-conviction setups
Adaptive: 65% consensus, 2 confirmations, 8-bar cooldown
Expected: Varies based on learning
Best for: Experienced users leveraging bandit system
How to Use
1. Initial Setup (5 Minutes):
Select Trading Mode matching your style (start with Balanced)
Enable Adaptive Learning (recommended for automatic agent selection)
Choose Thompson Sampling algorithm (best all-around performance)
Keep Microstructure Metrics enabled for liquid instruments (>100k daily volume)
2. Agent Tuning (Optional):
Adjust Agent Sensitivity multipliers (0.5-2.0):
<0.8 = Highly selective (fewer signals, higher quality)
0.9-1.2 = Balanced (recommended starting point)
1.3 = Aggressive (more signals, lower individual quality)
Monitor dashboard for 20-30 signals to identify dominant agent
If one agent consistently outperforms, consider using Lock Agent feature
3. Bandit Configuration (Advanced):
Blend Temperature (0.1-2.0):
0.3 = Sharp decisions (best agent dominates)
0.5 = Balanced (default)
1.0+ = Smooth (equal weighting, democratic)
Memory Decay (0.8-0.99):
0.90 = Fast adaptation (volatile markets)
0.95 = Balanced (most instruments)
0.97+ = Long memory (stable trends)
4. Signal Interpretation:
Green triangle (▲): Long signal confirmed
Red triangle (▼): Short signal confirmed
Dashboard shows:
Active agent (highlighted row with ► marker)
Win rate per agent (green >60%, yellow 40-60%, red <40%)
Confidence bars (█████ = maximum confidence)
Memory size (short-term buffer count)
Colored zones display:
Entry level (current close)
Stop-loss (1.5× ATR)
Take-profit 1 (2.0× ATR)
Take-profit 2 (3.5× ATR)
5. Risk Management:
Never risk >1-2% per signal (use ATR-based stops)
Signals are entry triggers, not complete strategies
Combine with your own market context analysis
Consider fundamental catalysts and news events
Use "Confirming" status to prepare entries (not to enter early)
6. Memory Persistence (Optional):
After 50-100 trades, check Memory Export Panel
Record displayed alpha/beta/weight values for each agent
Record VPIN and Kyle threshold values
Enable "Restore From Memory" and input saved values to continue learning
Useful when switching timeframes or restarting indicator
Visual Components
On-Chart Elements:
Spectral Layers: EMA8 ± 0.5 ATR bands (dynamic support/resistance, colored by trend)
Energy Radiance: Multi-layer glow boxes at signal points (intensity scales with confidence, configurable 1-5 layers)
Probability Cones: Projected price paths with uncertainty wedges (15-bar projection, width = confidence × ATR)
Connection Lines: Links sequential signals (solid = same direction continuation, dotted = reversal)
Kill Zones: Risk/reward boxes showing entry, stop-loss, and dual take-profit targets
Signal Markers: Triangle up/down at validated entry points
Dashboard (Configurable Position & Size):
Regime Indicator: 4-level trend classification (Strong Bull/Bear, Weak Bull/Bear)
Mode Status: Shows active system (Adaptive Blend, Locked Agent, or Consensus)
Agent Performance Table: Real-time win%, confidence, and memory stats
Order Flow Metrics: Toxicity and impact indicators (when microstructure enabled)
Signal Status: Current state (Long/Short/Confirming/Waiting) with confirmation progress
Memory Panel (Configurable Position & Size):
Live Parameter Export: Alpha, beta, and weight values per agent
Adaptive Thresholds: Current VPIN sensitivity and Kyle threshold
Save Reminder: Visual indicator if parameters should be recorded
What Makes This Original
This script's originality lies in three key innovations:
1. Genuine Meta-Learning Framework:
Unlike traditional indicator mashups that simply display multiple signals, this implements authentic reinforcement learning (multi-armed bandits) to learn which detection method works best in current conditions. The Thompson Sampling implementation with beta distribution tracking (alpha for successes, beta for failures) is statistically rigorous and adapts continuously. This is not post-hoc optimization—it's real-time learning.
2. Episodic Memory Architecture with Transfer Learning:
The dual-layer memory system mimics human learning patterns:
Short-term memory captures recent performance (recency bias)
Long-term memory preserves historical patterns (experience)
Automatic transfer mechanism consolidates knowledge
Memory boost creates positive feedback loops (successful strategies become stronger)
This architecture allows the system to adapt without retraining , unlike static ML models that require batch updates.
3. Institutional Microstructure Integration:
Combines retail-focused technical analysis (RSI, Bollinger Bands, VWAP) with institutional-grade microstructure metrics (VPIN, Kyle's Lambda, Hawkes processes) typically found in academic finance literature and professional trading systems, not standard retail platforms. While simplified for Pine Script constraints, these metrics provide insight into informed vs. uninformed trading , a dimension entirely absent from traditional technical analysis.
Mashup Justification:
The four agents are combined specifically for risk diversification across failure modes:
Spoofing Detector: Prevents false breakout losses from manipulation
Exhaustion Detector: Prevents chasing extended trends into reversals
Liquidity Void: Exploits volatility compression (different regime than trending)
Mean Reversion: Provides mathematical anchoring when patterns fail
The bandit system ensures the optimal tool is automatically selected for each market situation, rather than requiring manual interpretation of conflicting signals.
Why "ML-lite"? Simplifications and Approximations
This is the "lite" version due to necessary simplifications for Pine Script execution:
1. Simplified VPIN Calculation:
Academic Implementation: True VPIN uses volume bucketing (fixed-volume bars) and tick-by-tick buy/sell classification via Lee-Ready algorithm or exchange-provided trade direction flags
This Implementation: 20-bar rolling window with simple open/close heuristic (close > open = buy volume)
Impact: May misclassify volume during ranging/choppy markets; works best in directional moves
2. Pseudo-Random Sampling:
Academic Implementation: Thompson Sampling requires true random number generation from beta distributions using inverse transform sampling or acceptance-rejection methods
This Implementation: Deterministic pseudo-randomness derived from price and volume decimal digits: (close × 100 - floor(close × 100)) + (volume % 100) / 100
Impact: Not cryptographically random; may have subtle biases in specific price ranges; provides sufficient variation for agent selection
3. Hawkes Process Approximation:
Academic Implementation: Full Hawkes process uses maximum likelihood estimation with exponential kernels: λ(t) = μ + Σ α·exp(-β(t-tᵢ)) fitted via iterative optimization
This Implementation: Simple exponential decay (0.9 multiplier) with binary event triggers (volume spike = event)
Impact: Captures self-exciting property but lacks parameter optimization; fixed decay rate may not suit all instruments
4. Kyle's Lambda Simplification:
Academic Implementation: Estimated via regression of price impact on signed order flow over multiple time intervals: Δp = λ × Δv + ε
This Implementation: Simplified ratio: price_change / sqrt(volume_sum) without proper signed order flow or regression
Impact: Provides directional indicator of impact but not true market depth measurement; no statistical confidence intervals
5. Entropy Calculation:
Academic Implementation: True Shannon entropy requires probability distribution: H(X) = -Σ p(x)·log₂(p(x)) where p(x) is probability of each price change magnitude
This Implementation: Simple ratio of unique price changes to total observations (variety measure)
Impact: Measures diversity but not true information entropy with probability weighting; less sensitive to distribution shape
6. Memory System Constraints:
Full ML Implementation: Neural networks with backpropagation, experience replay buffers (storing state-action-reward tuples), gradient descent optimization, and eligibility traces
This Implementation: Fixed-size array queues with simple averaging; no gradient-based learning, no state representation beyond raw scores
Impact: Cannot learn complex non-linear patterns; limited to linear performance tracking
7. Limited Feature Engineering:
Advanced Implementation: Dozens of engineered features, polynomial interactions (x², x³), dimensionality reduction (PCA, autoencoders), feature selection algorithms
This Implementation: Raw agent scores and basic market metrics (RSI, ATR, volume ratio); minimal transformation
Impact: May miss subtle cross-feature interactions; relies on agent-level intelligence rather than feature combinations
8. Single-Instrument Data:
Full Implementation: Multi-asset correlation analysis (sector ETFs, currency pairs, volatility indices like VIX), lead-lag relationships, risk-on/risk-off regimes
This Implementation: Only OHLCV data from displayed instrument
Impact: Cannot incorporate broader market context; vulnerable to correlated moves across assets
9. Fixed Performance Horizon:
Full Implementation: Adaptive horizon based on trade duration, volatility regime, or profit target achievement
This Implementation: Fixed 8-bar evaluation window
Impact: May evaluate too early in slow markets or too late in fast markets; one-size-fits-all approach
Performance Impact Summary:
These simplifications make the script:
✅ Faster: Executes in milliseconds vs. seconds (or minutes) for full academic implementations
✅ More Accessible: Runs on any TradingView plan without external data feeds, APIs, or compute servers
✅ More Transparent: All calculations visible in Pine Script (no black-box compiled models)
✅ Lower Resource Usage: <500 bars lookback, minimal memory footprint
⚠️ Less Precise: Approximations may reduce statistical edge by 5-15% vs. academic implementations
⚠️ Limited Scope: Cannot capture tick-level dynamics, multi-order-book interactions, or cross-asset flows
⚠️ Fixed Parameters: Some thresholds hardcoded rather than dynamically optimized
When to Upgrade to Full Implementation:
Consider professional Python/C++ versions with institutional data feeds if:
Trading with >$100K capital where precision differences materially impact returns
Operating in microsecond-competitive environments (HFT, market making)
Requiring regulatory-grade audit trails and reproducibility
Backtesting with tick-level precision for strategy validation
Need true real-time adaptation with neural network-based learning
For retail swing/day trading and position management, these approximations provide sufficient signal quality while maintaining usability, transparency, and accessibility. The core logic—multi-agent detection with adaptive selection—remains intact.
Technical Notes
All calculations use standard Pine Script built-in functions ( ta.ema, ta.atr, ta.rsi, ta.bb, ta.sma, ta.stdev, ta.vwap )
VPIN and Kyle's Lambda use simplified formulas optimized for OHLCV data (see "Lite" section above)
Thompson Sampling uses pseudo-random noise from price/volume decimal digits for beta distribution sampling
No repainting: All calculations use confirmed bar data (no forward-looking)
Maximum lookback: 500 bars (set via max_bars_back parameter)
Performance evaluation: 8-bar forward-looking window for reward calculation (clearly disclosed)
Confidence threshold: Minimum 0.25 (25%) enforced on all signals
Memory arrays: Dynamic sizing with FIFO queue management
Limitations and Disclaimers
Not Predictive: This indicator identifies patterns in historical data. It cannot predict future price movements with certainty.
Requires Human Judgment: Signals are entry triggers, not complete trading strategies. Must be confirmed with your own analysis, risk management rules, and market context.
Learning Period Required: The adaptive system requires 50-100 bars minimum to build statistically meaningful performance data for bandit algorithms.
Overfitting Risk: Restoring memory parameters from one market regime to a drastically different regime (e.g., low volatility to high volatility) may cause poor initial performance until system re-adapts.
Approximation Limitations: Simplified calculations (see "Lite" section) may underperform academic implementations by 5-15% in highly efficient markets.
No Guarantee of Profit: Past performance, whether backtested or live-traded, does not guarantee future performance. All trading involves risk of loss.
Forward-Looking Bias: Performance evaluation uses 8-bar forward window—this creates slight look-ahead for learning (though not for signals). Real-time performance may differ from indicator's internal statistics.
Single-Instrument Limitation: Does not account for correlations with related assets or broader market regime changes.
Recommended Settings
Timeframe: 15-minute to 4-hour charts (sufficient volatility for ATR-based stops; adequate bar volume for learning)
Assets: Liquid instruments with >100k daily volume (forex majors, large-cap stocks, BTC/ETH, major indices)
Not Recommended: Illiquid small-caps, penny stocks, low-volume altcoins (microstructure metrics unreliable)
Complementary Tools: Volume profile, order book depth, market breadth indicators, fundamental catalysts
Position Sizing: Risk no more than 1-2% of capital per signal using ATR-based stop-loss
Signal Filtering: Consider external confluence (support/resistance, trendlines, round numbers, session opens)
Start With: Balanced mode, Thompson Sampling, Blend mode, default agent sensitivities (1.0)
After 30+ Signals: Review agent win rates, consider increasing sensitivity of top performers or locking to dominant agent
Alert Configuration
The script includes built-in alert conditions:
Long Signal: Fires when validated long entry confirmed
Short Signal: Fires when validated short entry confirmed
Alerts fire once per bar (after confirmation requirements met)
Set alert to "Once Per Bar Close" for reliability
Taking you to school. — Dskyz, Trade with insight. Trade with anticipation.

VMS Multi Index Options Buying Indicator📊 VMS Multi-Index Options Buying Indicator – Consolidated Overview
________________________________________
🎯 What It Is
A professional-grade options trading system that analyses multiple technical parameters to generate quantified buy signals for call and put options. It includes:
• Integrated risk management
• Multi-layered confirmation
• Quantified strength scores
________________________________________
⚡ Core Functionality
• Dual Analysis System: Call and put analysis running simultaneously
• Multi-Timeframe Analysis: Intraday to swing trading
• Quantified Scoring: Objective 0–7 strength scoring system
• Holistic Market View: Combines technicals, levels, volume, and momentum into a single signal
________________________________________
🔧 Technical Components
1. VMS Core Momentum System
• VMS SQZM Momentum: Primary oscillator (must be positive for both calls and puts)
• VMS Index Trends: Short-term and medium-term alignment
• Strength Scoring: 7-point system evaluating multiple parameters
2. Support/Resistance Levels (L0–L10)
Level Significance Options Trading Application
L00–L02 Strong Support Ideal for CALL BUY entries
L05 Critical Decision Point Wait for confirmation
L08–L9 Strong Resistance Ideal for PUT BUY entries
3. ATR Trend System
• Green Lines: Bullish momentum (favour calls)
• Red Lines: Bearish momentum (favour puts)
• ▲/▼ Triangles: Primary entry signals
• +L/+S Signals: Add-to-position opportunities
4. Volume Confirmation
• Real-time buy/sell volume analysis
• Cumulative volume trends
• Bullish/bearish candle counts
• Net volume direction confirmation
5. Spread Analysis
• Call-put spread direction and momentum
• Market sentiment gauge
• Options flow implications
________________________________________
📈 Signal Generation
Strength-Based Signals
• STRONG BUY: ≥4/7 strength points + clear advantage
• WEAK BUY: 3–3.9/7 strength points + modest advantage
• NO TRADE: All other scenarios
Critical Rules
• Both call and put VMS SQZM must be positive for any trade
• A clear strength advantage is required over the opposite option
• Volume confirmation enhances signal reliability
________________________________________
🧩 Ideal Trade Setups
Call Buy Setup
if (call_strength >= 4 and
call_strength > put_strength and
val_call > 0 and val_put > 0 and
ATR_trend_green and
price_near_support and
volume_bullish and
spread_positive_expanding):
execute_strong_call_buy()
Put Buy Setup
if (put_strength >= 4 and
put_strength > call_strength and
val_put > 0 and val_call > 0 and
ATR_trend_red and
price_near_resistance and
volume_bearish and
spread_negative_contracting):
execute_strong_put_buy()
________________________________________
📊 Dashboard Interpretation Guide
Section Call Buy Signal Put Buy Signal Critical Check
Spread Positive + Expanding Negative + Contracting Must confirm direction
VMS SQZM Green + Positive Green + Positive Both must be positive
Strength ≥4 & > Put ≥4 & > Call Primary decision factor
Squeeze "ON" preferred "ON" preferred Increases probability
Levels Near L00–L02 Near L08–L10 Confluence adds confidence
ATR Green + Rising Red + Falling Trend alignment
Volume Bullish patterns Bearish patterns Must confirm signal
________________________________________
⏰ Timeframe-Specific Strategies
Intraday Trading (5–15 min)
• Monitor strength changes every candle
• Use +L/+S for quick scalp entries
• Exit before last 30 minutes
• Tighter stops (50% premium)
Swing Trading (1H–Daily)
• Require ≥4.5 strength scores
• Focus on major level breaks (L00, L05, L10)
• Use wider stops (60% premium)
• Hold until the opposite signal generation
________________________________________
🛡️ Risk Management Integration
• Automatic position sizing based on signal strength
• Built-in exit triggers and stop-loss levels
• Daily trade limits and risk controls
________________________________________
💡 Unique Value
• Quantified scoring removes emotional trading
• Multiple confirmation layers reduce false signals
• Comprehensive dashboard for quick decision-making
• Options-specific analysis (not generic indicators)
________________________________________
🚨 Quick Decision Flowchart
1. Start → Check strength scores
2. Call ≥4 & > Put? → Yes → Check VMS SQZM >0? → Yes → ✅ Strong Call Buy
3. Put ≥4 & > Call? → Yes → Check VMS SQZM >0? → Yes → ✅ Strong Put Buy
4. Call ≥3 & > Put? → Yes → ✅ Weak Call Buy (reduced size)
5. Put ≥3 & > Call? → Yes → ✅ Weak Put Buy (reduced size)
6. ❌ No Trade – Wait for better setup
________________________________________
⚠️ Important Note
This is a decision support tool – not a guaranteed profit system. It requires:
• Proper risk management
• Trading experience
• Integration into a comprehensive trading strategy
Ideal for traders who want a systematic approach, objective signals, options focus, and multiple confirmation layers.
🎯 VMS Multi-Index Options Buying Indicator - MASTER CHEAT SHEET
📊 QUICK DECISION MATRIX
🟢 CALL BUY SIGNALS (All Must Align)
Component Strong Signal Weak Signal
Strength ≥4 & > Put 3-3.9 & > Put
VMS SQZM Both Positive Both Positive
Spread Positive + Expanding Positive
ATR Green + Rising Green
Levels L00-L02 Near Support
Volume Bullish Confirmed Mixed Bullish
Squeeze ON Any
🔴 PUT BUY SIGNALS (All Must Align)
Component Strong Signal Weak Signal
Strength ≥4 & > Call 3-3.9 & > Call
VMS SQZM Both Positive Both Positive
Spread Negative + Contracting Negative
ATR Red + Falling Red
Levels L08-L10 Near Resistance
Volume Bearish Confirmed Mixed Bearish
Squeeze ON Any
________________________________________
⚡ INSTANT EXECUTION RULES
✅ STRONG TRADES (High Conviction)
# STRONG CALL BUY
if (call_strength >= 4 and
call_strength > put_strength and
val_call > 0 and val_put > 0):
execute_call_buy()
# STRONG PUT BUY
if (put_strength >= 4 and
put_strength > call_strength and
val_put > 0 and val_call > 0):
execute_put_buy()
🟡 WEAK TRADES (Reduced Size Only)
if strength >= 3 and strength > opposite_strength:
execute_weak_trade() # 30-50% normal size
❌ NO TRADE CONDITIONS
if (any_vms_sqzm_negative or
both_strengths >= 3 or
strength < 3 or
no_clear_advantage):
AVOID_TRADE()
________________________________________
🎯 CONFIRMATION HIERARCHY
PERFECT CALL SETUP
1. ✅ Strength: Call ≥4, Put < Call
2. ✅ VMS SQZM: Both positive
3. ✅ Spread: Positive & Expanding
4. ✅ ATR: Green + Rising
5. ✅ Levels: Near L00-L02 support
6. ✅ Volume: Bullish confirmation
7. ✅ Squeeze: ON
PERFECT PUT SETUP
1. ✅ Strength: Put ≥4, Call < Put
2. ✅ VMS SQZM: Both positive
3. ✅ Spread: Negative & Contracting
4. ✅ ATR: Red + Falling
5. ✅ Levels: Near L08-L10 resistance
6. ✅ Volume: Bearish confirmation
7. ✅ Squeeze: ON
________________________________________
📈 POSITION MANAGEMENT
🎚️ Sizing Matrix
Signal Strength Position Size Stop Loss Profit Target
≥4 (STRONG) 70-80% normal 50-60% premium 1:1 R:R + Trail
3-3.9 (WEAK) 30-50% normal 40-50% premium Quick 1:1
<3 (NO TRADE) 0% N/A N/A
🚪 Exit Triggers
• Stop Loss: 50-60% premium loss OR VMS SQZM turns negative
• Profit Taking: 50% at 1:1, trail balance using VMS Index
• Signal Exit: Opposite strength reaches ≥3 OR current strength drops below entry
________________________________________
⏰ TIMEFRAME STRATEGIES
🔄 Intraday (5-15 min)
• Monitor strength changes every candle
• Exit before last 30 minutes
• Tighter stops (50% premium)
• Use +L/+S for quick scalps
📅 Swing (1H-Daily)
• Require ≥4.5 strength scores
• Focus on major level breaks
• Wider stops (60% premium)
• Hold until opposite signal
________________________________________
🛡️ RISK MANAGEMENT
📉 Daily Limits
• Max Trades: 3 per day
• Max Risk: 2% capital per trade
• Loss Limit: Stop after 2 consecutive losses
• Portfolio: Never trade both call/put simultaneously
🧠 Psychological Rules
1. Wait for clear signals - don't force
2. Respect strength scoring - no overrides
3. Stick to position sizing - no revenge trading
4. Accept "NO TRADE" as valid outcome
________________________________________
🚀 QUICK START FLOW
1. CHECK Strength Scores
2. CONFIRM VMS SQZM Both Positive
3. VALIDATE Spread Direction
4. ALIGN ATR Trend
5. CONFIRM Volume & Levels
6. EXECUTE or WAIT
________________________________________
📊 VMS DASHBOARD FLOWCHART
START → Check Strength Scores
↓
→ YES → → YES → 🟢 STRONG CALL
↓ NO ↓ NO
→ YES → → YES → 🔴 STRONG PUT
↓ NO ↓ NO
→ YES → 🟡 WEAK CALL (Reduce Size)
↓ NO
→ YES → 🟡 WEAK PUT (Reduce Size)
↓ NO
❌ NO TRADE - Wait
________________________________________
⚠️ CRITICAL REMINDERS
• MUST: Both VMS SQZM positive for ANY trade
• MUST: Clear strength advantage (≥0.5 difference)
• PREFER: Volume confirmation for maximum size
• AVOID: Trading during news events
• RESPECT: Daily risk limits
________________________________________
💡 SUCCESS FORMULA
Patience + Confirmation + Risk Management = Consistent Results
Wait for ≥4 strength signals with multiple confirmations, always use proper position sizing, and journal every trade.
Happy Trading! 📈
Remember: This system provides probabilities, not guarantees. Always trade with proper risk management and within your financial means.

Opening Range Breakout with Multi-Timeframe Liquidity]═══════════════════════════════════════
OPENING RANGE BREAKOUT WITH MULTI-TIMEFRAME LIQUIDITY
═══════════════════════════════════════
A professional Opening Range Breakout (ORB) indicator enhanced with multi-timeframe liquidity detection, trading session visualization, volume analysis, and trend confirmation tools. Designed for intraday trading with comprehensive alert system.
───────────────────────────────────────
WHAT THIS INDICATOR DOES
───────────────────────────────────────
This indicator combines multiple trading concepts:
- Opening Range Breakout (ORB) - Customizable time period detection with automatic high/low identification
- Multi-Timeframe Liquidity - HTF (Higher Timeframe) and LTF (Lower Timeframe) key level detection
- Trading Sessions - Tokyo, London, New York, and Sydney session visualization
- Volume Analysis - Volume spike detection and strength measurement
- Multi-Timeframe Confirmation - Trend bias from higher timeframes
- EMA Integration - Trend filter and dynamic support/resistance
- Smart Alerts - Quality-filtered breakout notifications
───────────────────────────────────────
HOW IT WORKS
───────────────────────────────────────
OPENING RANGE BREAKOUT (ORB):
Concept:
The Opening Range is a period at the start of a trading session where price establishes an initial high and low. Breakouts beyond this range often indicate the direction of the day's trend.
Detection Method:
- Default: 15-minute opening range (configurable)
- Custom Range: Set specific session times with timezone support
- Automatically identifies ORH (Opening Range High) and ORL (Opening Range Low)
- Tracks ORB mid-point for reference
Range Establishment:
1. Session starts (or custom time begins)
2. Tracks highest high and lowest low during the period
3. Range confirmed at end of opening period
4. Levels extend throughout the session
Breakout Detection:
- Bullish Breakout: Close above ORH
- Bearish Breakout: Close below ORL
- Mid-point acts as bias indicator
Visual Display:
- Shaded box during range formation
- Horizontal lines for ORH, ORL, and mid-point
- Labels showing level values
- Color-coded fills based on selected method
Fill Color Methods:
1. Session Comparison:
- Green: Current OR mid > Previous OR mid
- Red: Current OR mid < Previous OR mid
- Gray: Equal or first session
- Shows day-over-day momentum
2. Breakout Direction (Recommended):
- Green: Price currently above ORH (bullish breakout)
- Red: Price currently below ORL (bearish breakout)
- Gray: Price inside range (no breakout)
- Real-time breakout status
MULTI-TIMEFRAME LIQUIDITY:
Two-Tier System for comprehensive level identification:
HTF (Higher Timeframe) Key Liquidity:
- Default: 4H timeframe (configurable to Daily, Weekly)
- Identifies major institutional levels
- Uses pivot detection with adjustable parameters
- Suitable for swing highs/lows where large orders rest
LTF (Lower Timeframe) Key Liquidity:
- Default: 1H timeframe (configurable)
- Provides precision entry/exit levels
- Finer granularity for intraday trading
- Captures minor swing points
Calculation Method:
- Pivot high/low detection algorithm
- Configurable left bars (lookback) and right bars (confirmation)
- Timeframe multiplier for accurate multi-timeframe detection
- Automatic level extension
Mitigation System:
- Tracks when levels are swept (broken)
- Configurable mitigation type: Wick or Close-based
- Option to remove or show mitigated levels
- Display limit prevents chart clutter
Asset-Specific Optimization:
The indicator includes quick reference settings for different assets:
- Major Forex (EUR/USD, GBP/USD): Default settings optimal
- Crypto (BTC/ETH): Left=12, Right=4, Display=7
- Gold: HTF=1D, Left=20
TRADING SESSIONS:
Four Major Sessions with Full Customization:
Tokyo Session:
- Default: 04:00-13:00 UTC+4
- Asian trading hours
- Often sets daily range
London Session:
- Default: 11:00-20:00 UTC+4
- Highest liquidity period
- Major institutional activity
New York Session:
- Default: 16:00-01:00 UTC+4
- US market hours
- High-impact news events
Sydney Session:
- Default: 01:00-10:00 UTC+4
- Earliest Asian activity
- Lower volatility
Session Features:
- Shaded background boxes
- Session name labels
- Optional open/close lines
- Session high/low tracking with colored lines
- Each session has independent color settings
- Fully customizable times and timezones
VOLUME ANALYSIS:
Volume-Based Trade Confirmation:
Volume MA:
- Configurable period (default: 20)
- Establishes average volume baseline
- Used for spike detection
Volume Spike Detection:
- Identifies when volume exceeds MA * multiplier
- Default: 1.5x average volume
- Confirms breakout strength
Volume Strength Measurement:
- Calculates current volume as percentage of average
- Shows relative volume intensity
- Used in alert quality filtering
High Volume Bars:
- Identifies bars above 50th percentile
- Additional confirmation layer
- Indicates institutional participation
MULTI-TIMEFRAME CONFIRMATION:
Trend Bias from Higher Timeframes:
HTF 1 (Trend):
- Default: 1H timeframe
- Uses EMA to determine intermediate trend
- Compares current timeframe EMA to HTF EMA
HTF 2 (Bias):
- Default: 4H timeframe
- Uses 50 EMA for longer-term bias
- Confirms overall market direction
Bias Classifications:
- Bullish Bias: HTF close > HTF 50 EMA AND Current EMA > HTF1 EMA
- Bearish Bias: HTF close < HTF 50 EMA AND Current EMA < HTF1 EMA
- Neutral Bias: Mixed signals between timeframes
EMA Stack Analysis:
- Compares EMA alignment across timeframes
- +1: Bullish stack (lower TF EMA > higher TF EMA)
- -1: Bearish stack (lower TF EMA < higher TF EMA)
- 0: Neutral/crossed
Usage:
- Filters false breakouts
- Confirms trend direction
- Improves trade quality
EMA INTEGRATION:
Dynamic EMA for Trend Reference:
Features:
- Configurable period (default: 20)
- Customizable color and width
- Acts as dynamic support/resistance
- Trend filter for ORB trades
Application:
- Above EMA: Favor long breakouts
- Below EMA: Favor short breakouts
- EMA cross: Potential trend change
- Distance from EMA: Momentum gauge
SMART ALERT SYSTEM:
Quality-Filtered Breakout Notifications:
Alert Types:
1. Standard ORB Breakout
2. High Quality ORB Breakout
Quality Criteria:
- Volume Confirmation: Volume > 1.2x average
- MTF Confirmation: Bias aligned with breakout direction
Standard Alert:
- Basic breakout detection
- Price crosses ORH or ORL
- Icon: 🚀 (bullish) or 🔻 (bearish)
High Quality Alert:
- Both volume AND MTF confirmed
- Stronger probability setup
- Icon: 🚀⭐ (bullish) or 🔻⭐ (bearish)
Alert Information Includes:
- Alert quality rating
- Breakout level and current price
- Volume strength percentage (if enabled)
- MTF bias status (if enabled)
- Recommended action
One Alert Per Bar:
- Prevents alert spam
- Uses flag system to track sent alerts
- Resets on new ORB session
───────────────────────────────────────
HOW TO USE
───────────────────────────────────────
OPENING RANGE SETUP:
Basic Configuration:
1. Select time period for opening range (default: 15 minutes)
2. Choose fill color method (Breakout Direction recommended)
3. Enable historical data display if needed
Custom Range (Advanced):
1. Enable Custom Range toggle
2. Set specific session time (e.g., 0930-0945)
3. Select appropriate timezone
4. Useful for specific market opens (NYSE, LSE, etc.)
LIQUIDITY LEVELS SETUP:
Quick Configuration by Asset:
- Forex: Use default settings (Left=15, Right=5)
- Crypto: Set Left=12, Right=4, Display=7
- Gold: Set HTF=1D, Left=20
HTF Liquidity:
- Purpose: Major support/resistance levels
- Recommended: 4H for day trading, 1D for swing trading
- Use as profit targets or reversal zones
LTF Liquidity:
- Purpose: Entry/exit refinement
- Recommended: 1H for day trading, 4H for swing trading
- Use for position management
Mitigation Settings:
- Wick-based: More sensitive (default)
- Close-based: More conservative
- Remove or Show mitigated levels based on preference
TRADING SESSIONS SETUP:
Enable/Disable Sessions:
- Master toggle for all sessions
- Individual session controls
- Show/hide session names
Session High/Low Lines:
- Enable to see session extremes
- Each session has custom colors
- Useful for range trading
Customization:
- Adjust session times for your broker
- Set timezone to match your location
- Customize colors for visibility
VOLUME ANALYSIS SETUP:
Enable Volume Analysis:
1. Toggle on Volume Analysis
2. Set MA length (20 recommended)
3. Adjust spike multiplier (1.5 typical)
Usage:
- Confirm breakouts with volume
- Identify climactic moves
- Filter false signals
MULTI-TIMEFRAME SETUP:
HTF Selection:
- HTF 1 (Trend): 1H for day trading, 4H for swing
- HTF 2 (Bias): 4H for day trading, 1D for swing
Interpretation:
- Trade only with bias alignment
- Neutral bias: Be cautious
- Bias changes: Potential reversals
EMA SETUP:
Configuration:
- Period: 20 for responsive, 50 for smoother
- Color: Choose contrasting color
- Width: 1-2 for visibility
Usage:
- Filter trades: Long above, Short below
- Dynamic support/resistance reference
- Trend confirmation
ALERT SETUP:
TradingView Alert Creation:
1. Enable alerts in indicator settings
2. Enable ORB Breakout Alerts
3. Right-click chart → Add Alert
4. Select this indicator
5. Choose "Any alert() function call"
6. Configure delivery method (mobile, email, webhook)
Alert Filtering:
- All alerts include quality rating
- High Quality alerts = Volume + MTF confirmed
- Standard alerts = Basic breakout only
───────────────────────────────────────
TRADING STRATEGIES
───────────────────────────────────────
CLASSIC ORB STRATEGY:
Setup:
1. Wait for opening range to complete
2. Price breaks and closes above ORH or below ORL
3. Volume > average (if enabled)
4. MTF bias aligned (if enabled)
Entry:
- Bullish: Buy on break above ORH
- Bearish: Sell on break below ORL
- Consider retest entries for better risk/reward
Stop Loss:
- Bullish: Below ORL or range mid-point
- Bearish: Above ORH or range mid-point
- Adjust based on volatility
Targets:
- Initial: Range width extension (ORH + range width)
- Secondary: HTF liquidity levels
- Final: Session high/low or major support/resistance
ORB + LIQUIDITY CONFLUENCE:
Enhanced Setup:
1. Opening range established
2. HTF liquidity level near or beyond ORH/ORL
3. Breakout occurs with volume
4. Price targets the liquidity level
Entry:
- Enter on ORB breakout
- Target the HTF liquidity level
- Use LTF liquidity for position management
Management:
- Partial profits at ORB + range width
- Move stop to breakeven at LTF liquidity
- Final exit at HTF liquidity sweep
ORB REJECTION STRATEGY (Counter-Trend):
Setup:
1. Price breaks above ORH or below ORL
2. Weak volume (below average)
3. MTF bias opposite to breakout
4. Price closes back inside range
Entry:
- Failed bullish break: Short below ORH
- Failed bearish break: Long above ORL
Stop Loss:
- Beyond the failed breakout level
- Or beyond session extreme
Target:
- Opposite end of opening range
- Range mid-point for partial profit
SESSION-BASED ORB TRADING:
Tokyo Session:
- Typically narrower ranges
- Good for range trading
- Wait for London open breakout
London Session:
- Highest volume and volatility
- Strong ORB setups
- Major liquidity sweeps common
New York Session:
- Strong trending moves
- News-driven volatility
- Good for momentum trades
Sydney Session:
- Quieter conditions
- Suitable for range strategies
- Sets up Tokyo session
EMA-FILTERED ORB:
Rules:
- Only take bullish breaks if price > EMA
- Only take bearish breaks if price < EMA
- Ignore counter-trend breaks
Benefits:
- Reduces false signals
- Aligns with larger trend
- Improves win rate
───────────────────────────────────────
CONFIGURATION GUIDE
───────────────────────────────────────
OPENING RANGE SETTINGS:
Time Period:
- 15 min: Standard for most markets
- 30 min: Wider range, fewer breakouts
- 60 min: For slower markets or swing trades
Custom Range:
- Use for specific market opens
- NYSE: 0930-1000 EST
- LSE: 0800-0830 GMT
- Set timezone to match exchange
Historical Display:
- Enable: See all previous session data
- Disable: Cleaner chart, current session only
LIQUIDITY SETTINGS:
Left Bars (5-30):
- Lower: More frequent, sensitive levels
- Higher: Fewer, more significant levels
- Recommended: 15 for most markets
Right Bars (1-25):
- Confirmation period
- Higher: More reliable, less frequent
- Recommended: 5 for balance
Display Limit (1-20):
- Number of active levels shown
- Higher: More context, busier chart
- Recommended: 7 for clarity
Extension Options:
- Short: Levels visible near formation
- Current: Extended to current bar (recommended)
- Max: Extended indefinitely
VOLUME SETTINGS:
MA Length (5-50):
- Shorter: More responsive to spikes
- Longer: Smoother baseline
- Recommended: 20 for balance
Spike Multiplier (1.0-3.0):
- Lower: More sensitive spike detection
- Higher: Only extreme spikes
- Recommended: 1.5 for day trading
MULTI-TIMEFRAME SETTINGS:
HTF 1 (Trend):
- 5m chart: Use 15m or 1H
- 15m chart: Use 1H or 4H
- 1H chart: Use 4H or 1D
HTF 2 (Bias):
- One level higher than HTF 1
- Provides longer-term context
- Don't use same as HTF 1
EMA SETTINGS:
Length:
- 20: Responsive, more signals
- 50: Smoother, stronger filter
- 200: Long-term trend only
Style:
- Choose contrasting color
- Width 1-2 for visibility
- Match your trading style
───────────────────────────────────────
BEST PRACTICES
───────────────────────────────────────
Chart Timeframe Selection:
- ORB Trading: Use 5m or 15m charts
- Session Review: Use 1H or 4H charts
- Swing Trading: Use 1H or 4H charts
Quality Over Quantity:
- Wait for high-quality alerts (volume + MTF)
- Avoid trading every breakout
- Focus on confluence setups
Risk Management:
- Position size based on range width
- Wider ranges = smaller positions
- Use stop losses always
- Take partial profits at targets
Market Conditions:
- Best results in trending markets
- Reduce position size in choppy conditions
- Consider session overlaps for volatility
- Avoid trading near major news if inexperienced
Continuous Improvement:
- Track win rate by session
- Note which confluence factors work best
- Adjust settings based on market volatility
- Review performance weekly
───────────────────────────────────────
PERFORMANCE OPTIMIZATION
───────────────────────────────────────
This indicator is optimized with:
- max_bars_back declarations for efficient processing
- Conditional calculations based on enabled features
- Proper memory management for drawing objects
- Minimal recalculation on each bar
Best Practices:
- Disable unused features (sessions, MTF, volume)
- Limit historical display to reduce rendering
- Use appropriate timeframe for your strategy
- Clear old drawing objects periodically
───────────────────────────────────────
EDUCATIONAL DISCLAIMER
───────────────────────────────────────
This indicator combines established trading concepts:
- Opening Range Breakout theory (price action)
- Liquidity level detection (pivot analysis)
- Session-based trading (time-of-day patterns)
- Volume analysis (confirmation technique)
- Multi-timeframe analysis (trend alignment)
All calculations use standard technical analysis methods:
- Pivot high/low detection algorithms
- Moving averages for trend and volume
- Session time filtering
- Timeframe security functions
The indicator identifies potential trading setups but does not predict future price movements. Success requires proper application within a complete trading strategy including risk management, position sizing, and market context.
───────────────────────────────────────
USAGE DISCLAIMER
───────────────────────────────────────
This tool is for educational and analytical purposes. Opening Range Breakout trading involves substantial risk. The alert system and quality filters are designed to identify potential setups but do not guarantee profitability. Always conduct independent analysis, use proper risk management, and never risk capital you cannot afford to lose. Past performance does not indicate future results. Trading intraday breakouts requires experience and discipline.
───────────────────────────────────────
CREDITS & ATTRIBUTION
───────────────────────────────────────
ORIGINAL SOURCE:
This indicator builds upon concepts from LuxAlgo's-ORB

Harmonic Patterns Pro 1.0 [abusuhil]# Harmonic Patterns Pro 1.0
## 📊 Professional Harmonic Pattern Detector - All 10 Classical Models
**Harmonic Patterns Pro** is a comprehensive, non-repainting indicator that automatically detects and displays all 10 classical harmonic patterns in real-time. Built with precision and professional traders in mind, this indicator helps you identify high-probability reversal zones based on Fibonacci ratios.
---
## ✨ Key Features
### 🎯 10 Harmonic Patterns Supported
- **Gartley** - The most common harmonic pattern
- **Bat** - High accuracy with tight stop loss
- **Butterfly** - Extended pattern with strong reversal potential
- **Crab** - Extreme extension pattern (1.618 XA)
- **Deep Crab** - Deeper B retracement variant
- **Shark** - Unique C point extension pattern
- **Cypher** - C extends beyond A, tight stop loss
- **AB=CD** - Simple equal-leg pattern
- **Alternate Bat** - Bat variation with D beyond X
- **Three Drives** - Three equal impulse moves
### 🔒 100% Non-Repainting
- Patterns are drawn **only after completion** (candle close)
- Once drawn, patterns **stay permanently** on the chart
- No future data used - completely reliable for live trading
- What you see in history is what you get in real-time
### 🎚️ 5 Sensitivity Levels
Choose the detection accuracy that fits your trading style:
- **Strict (±2%)** - Highest accuracy, fewer signals
- **Medium-Strict (±5%)** - Good balance
- **Medium (±8%)** - Recommended for most traders
- **Medium-Loose (±12%)** - More patterns detected
- **Loose (±18%)** - Maximum pattern detection
### 🎨 Advanced Visual Design
- **PRZ Zone**: Automatic Potential Reversal Zone highlighting
- **Pattern Fill**: Shaded area between pattern lines for clarity
- **XABCD Points**: Clear labeling of all pivot points
- **Color Coded**: Green for bullish, red for bearish patterns
- **Customizable**: Adjust colors, opacity, line styles, label sizes
### 📈 Complete Trading System
- **Entry Signals**: Clear BUY/SELL labels at point D
- **3 Profit Targets**: TP1 (38.2%), TP2 (61.8%), TP3 (100% CD)
- **Stop Loss**: Automatically calculated and displayed
- **Entry Timing**: Option to enter at D or next candle
- **Pattern Names**: Each pattern labeled (e.g., "Bullish Bat")
### 🧹 Simplified Mode
- Toggle to hide all decorations
- Shows only: BUY/SELL signals, targets, and stop loss
- Perfect for experienced traders who want a clean chart
### 🚫 Anti-Overlap System
- **Minimum Bars Between Patterns** setting
- Prevents cluttered charts with overlapping patterns
- Ensures only the most recent, valid patterns are displayed
- Adjustable from 5 to 50 bars
### 🔔 Smart Alert System
- **3 Alert Types**: Buy Signal, Sell Signal, Any Signal
- **Signal Tester Compatible**: Works with backtesting tools
- **alertcondition()** method for TradingView alerts
- Get notified immediately when patterns complete
---
## 🚀 Quick Start Guide
### Recommended Settings (Beginners)
```
ZigZag Length: 12
Sensitivity: Medium
PRZ Opacity: 40
Fill Opacity: 30
Entry on Next Candle: false
Simplified Mode: false
Min Bars Between Patterns: 15
```
### For Live Trading
```
Entry on Next Candle: true ← Important!
```
### For Clean Charts
```
Simplified Mode: true
```
---
## 📊 Best Practices
### Timeframes
- **Best**: 4H, Daily, Weekly
- **Good**: 1H, 2H
- **Acceptable**: 15m, 30m
### Markets
Works on **all markets**: Forex, Stocks, Crypto, Commodities, Indices
### Risk Management
- Risk per trade: 1-2% of account
- Stop Loss: Use indicator's calculated SL
- Profit Targets: Scale out at TP1, TP2, TP3
- Minimum R:R: 1:2
---
## 🎓 Trading Strategies
### Strategy 1: Conservative
- Sensitivity: Strict
- Entry on Next Candle: true
- Confirm with RSI/MACD
### Strategy 2: Aggressive
- Sensitivity: Medium-Loose
- Quick entry and exit
- Scale out at TP1, TP2
### Strategy 3: Swing Trading
- Sensitivity: Strict
- Timeframe: 4H, Daily
- Hold to TP3
### Strategy 4: Multi-Timeframe
- Identify pattern on higher timeframe
- Enter on lower timeframe pattern
---
## 🔔 Setting Up Alerts
1. Right-click on chart → **"Add Alert"**
2. Condition → **"Harmonic Patterns Pro 1.0 "**
3. Choose: Buy Signal / Sell Signal / Any Signal
4. Click **"Create"**
---
## ❓ FAQ
**Q: Does this indicator repaint?**
A: No. 100% non-repainting.
**Q: What's the best sensitivity setting?**
A: Start with "Medium".
**Q: How many patterns should I expect?**
A: Daily: 1-3/month. 1H: 5-10/week.
**Q: Can I use this for backtesting?**
A: Yes! Compatible with Signal Tester.
**Q: Should I trade every pattern?**
A: No. Focus on quality setups.
**Q: What's the typical win rate?**
A: Beginners: 40-50%, Advanced: 65-75%.
---
## 🎯 Why Choose This Indicator?
✅ **Comprehensive** - All 10 patterns in one
✅ **Reliable** - 100% non-repainting
✅ **Professional** - Clean, customizable design
✅ **Complete** - Entry, targets, stop loss included
✅ **User-Friendly** - Easy to use
✅ **Flexible** - Works on all markets and timeframes
---
## ⚠️ Disclaimer
This indicator is a tool for technical analysis and should not be considered financial advice. Trading involves substantial risk of loss. Always use proper risk management and never risk more than you can afford to lose.
---
## 🏆 Final Words
**Harmonic Patterns Pro 1.0** combines classical harmonic pattern theory with modern automation. Start identifying high-probability reversal zones today!
**Version**: 1.0 | **Author**: | **Last Updated**: October 2025
**Happy Trading! 📊✨**
---
---
---
# ═══════════════════════════════════════════════════════════
# 🌟 النسخة العربية | ARABIC VERSION 🌟
# ═══════════════════════════════════════════════════════════
---
---
---
# مؤشر نماذج الهارمونيك الاحترافي 1.0
## 📊 كاشف احترافي لنماذج الهارمونيك - جميع النماذج العشرة الكلاسيكية
**مؤشر نماذج الهارمونيك الاحترافي** هو مؤشر شامل وغير معاد الرسم يكتشف ويعرض تلقائياً جميع نماذج الهارمونيك الكلاسيكية العشرة في الوقت الفعلي. تم بناؤه بدقة ومع وضع المتداولين المحترفين في الاعتبار، يساعدك هذا المؤشر على تحديد مناطق الانعكاس عالية الاحتمالية بناءً على نسب فيبوناتشي.
---
## ✨ الميزات الرئيسية
### 🎯 دعم 10 نماذج هارمونيك
- **Gartley (جارتلي)** - النموذج الأكثر شيوعاً
- **Bat (الخفاش)** - دقة عالية مع وقف خسارة ضيق
- **Butterfly (الفراشة)** - نموذج ممتد مع إمكانية انعكاس قوية
- **Crab (السلطعون)** - نموذج امتداد متطرف (1.618 XA)
- **Deep Crab (السلطعون العميق)** - نسخة أعمق من السلطعون
- **Shark (القرش)** - نموذج فريد بامتداد النقطة C
- **Cypher (السايفر)** - C تمتد بعد A، وقف خسارة ضيق
- **AB=CD** - نموذج بسيط بأرجل متساوية
- **Alternate Bat (الخفاش البديل)** - نسخة من الخفاش مع D بعد X
- **Three Drives (الدفعات الثلاث)** - ثلاث حركات دفع متساوية
### 🔒 عدم إعادة الرسم 100%
- يتم رسم النماذج **فقط بعد الاكتمال** (إغلاق الشمعة)
- بمجرد الرسم، تبقى النماذج **بشكل دائم** على الشارت
- لا يتم استخدام بيانات مستقبلية - موثوق تماماً للتداول المباشر
- ما تراه في التاريخ هو ما تحصل عليه في الوقت الفعلي
### 🎚️ 5 مستويات حساسية
اختر دقة الكشف التي تناسب أسلوب التداول الخاص بك:
- **Strict (صارم ±2%)** - أعلى دقة، إشارات أقل
- **Medium-Strict (متوسط-صارم ±5%)** - توازن جيد
- **Medium (متوسط ±8%)** - موصى به لمعظم المتداولين
- **Medium-Loose (متوسط-مرن ±12%)** - اكتشاف المزيد من النماذج
- **Loose (مرن ±18%)** - أقصى اكتشاف للنماذج
### 🎨 تصميم مرئي متقدم
- **منطقة PRZ**: تمييز تلقائي لمنطقة الانعكاس المحتملة
- **تظليل النموذج**: منطقة مظللة بين خطوط النموذج للوضوح
- **نقاط XABCD**: تسمية واضحة لجميع نقاط المحور
- **ترميز لوني**: أخضر للنماذج الصاعدة، أحمر للنماذج الهابطة
- **قابل للتخصيص**: ضبط الألوان، الشفافية، أنماط الخطوط، أحجام الملصقات
### 📈 نظام تداول كامل
- **إشارات الدخول**: ملصقات BUY/SELL واضحة عند النقطة D
- **3 أهداف ربح**: TP1 (38.2%)، TP2 (61.8%)، TP3 (100% CD)
- **وقف الخسارة**: يتم حسابه وعرضه تلقائياً
- **توقيت الدخول**: خيار للدخول عند D أو الشمعة التالية
- **أسماء النماذج**: كل نموذج مُسمى (مثل "Bullish Bat")
### 🧹 الوضع المبسط
- تبديل لإخفاء جميع الزخارف
- يعرض فقط: إشارات BUY/SELL، الأهداف، ووقف الخسارة
- مثالي للمتداولين ذوي الخبرة الذين يريدون شارت نظيف
### 🚫 نظام منع التداخل
- إعداد **الحد الأدنى من الشموع بين النماذج**
- يمنع الشارت المزدحم بالنماذج المتداخلة
- يضمن عرض النماذج الأحدث والصالحة فقط
- قابل للتعديل من 5 إلى 50 شمعة
### 🔔 نظام تنبيهات ذكي
- **3 أنواع تنبيهات**: إشارة شراء، إشارة بيع، أي إشارة
- **متوافق مع Signal Tester**: يعمل مع أدوات الاختبار الخلفي
- طريقة **alertcondition()** لتنبيهات TradingView
- احصل على إشعار فوري عند اكتمال النماذج
---
## 🚀 دليل البدء السريع
### الإعدادات الموصى بها (للمبتدئين)
```
ZigZag Length: 12
Sensitivity: Medium
PRZ Opacity: 40
Fill Opacity: 30
Entry on Next Candle: false
Simplified Mode: false
Min Bars Between Patterns: 15
```
### للتداول المباشر
```
Entry on Next Candle: true ← مهم!
```
### للشارت النظيف
```
Simplified Mode: true
```
---
## 📊 أفضل الممارسات
### الأطر الزمنية
- **الأفضل**: 4 ساعات، يومي، أسبوعي
- **جيد**: ساعة، ساعتين
- **مقبول**: 15 دقيقة، 30 دقيقة
### الأسواق
يعمل على **جميع الأسواق**: الفوركس، الأسهم، العملات الرقمية، السلع، المؤشرات
### إدارة المخاطر
- المخاطرة لكل صفقة: 1-2% من الحساب
- وقف الخسارة: استخدم SL المحسوب من المؤشر
- أهداف الربح: خذ أرباح تدريجية عند TP1، TP2، TP3
- الحد الأدنى للمخاطرة/العائد: 1:2
---
## 🎓 استراتيجيات التداول
### الاستراتيجية 1: المحافظة
- الحساسية: Strict (صارم)
- الدخول من الشمعة التالية: true
- التأكيد مع RSI/MACD
### الاستراتيجية 2: العدوانية
- الحساسية: Medium-Loose (متوسط-مرن)
- دخول وخروج سريع
- أخذ أرباح تدريجية عند TP1، TP2
### الاستراتيجية 3: السوينج
- الحساسية: Strict (صارم)
- الإطار الزمني: 4 ساعات، يومي
- الاحتفاظ حتى TP3
### الاستراتيجية 4: متعدد الأطر الزمنية
- تحديد النموذج على إطار زمني أعلى
- الدخول على نموذج إطار زمني أقل
---
## 🔔 إعداد التنبيهات
1. انقر بزر الماوس الأيمن على الشارت → **"Add Alert"**
2. الشرط → **"Harmonic Patterns Pro 1.0 "**
3. اختر: Buy Signal / Sell Signal / Any Signal
4. اضغط **"Create"**
---
## ❓ الأسئلة الشائعة
**س: هل يعيد المؤشر الرسم؟**
ج: لا. عدم إعادة الرسم 100%.
**س: ما هو أفضل إعداد للحساسية؟**
ج: ابدأ بـ "Medium" (متوسط).
**س: كم عدد النماذج المتوقعة؟**
ج: يومي: 1-3 شهرياً. ساعة: 5-10 أسبوعياً.
**س: هل يمكنني استخدامه للاختبار الخلفي؟**
ج: نعم! متوافق مع Signal Tester.
**س: هل يجب أن أتداول كل نموذج؟**
ج: لا. ركز على الإعدادات عالية الجودة.
**س: ما هو معدل الربح النموذجي؟**
ج: المبتدئون: 40-50%، المتقدمون: 65-75%.
---
## 🎯 لماذا تختار هذا المؤشر؟
✅ **شامل** - جميع النماذج العشرة في مؤشر واحد
✅ **موثوق** - عدم إعادة الرسم 100%
✅ **احترافي** - تصميم نظيف وقابل للتخصيص
✅ **كامل** - الدخول، الأهداف، ووقف الخسارة مشمولة
✅ **سهل الاستخدام** - سهل الاستخدام
✅ **مرن** - يعمل على جميع الأسواق والأطر الزمنية
---
## ⚠️ إخلاء المسؤولية
هذا المؤشر هو أداة للتحليل الفني ولا ينبغي اعتباره نصيحة مالية. التداول ينطوي على مخاطر كبيرة للخسارة. استخدم دائماً إدارة المخاطر المناسبة ولا تخاطر أبداً بأكثر مما يمكنك تحمل خسارته.
---
## 🏆 الكلمة الأخيرة
**مؤشر نماذج الهارمونيك الاحترافي 1.0** يجمع بين نظرية نماذج الهارمونيك الكلاسيكية والأتمتة الحديثة. ابدأ في تحديد مناطق الانعكاس عالية الاحتمالية اليوم!
**الإصدار**: 1.0 | **المطور**: | **آخر تحديث**: أكتوبر 2025
**تداول موفق! 📊✨**
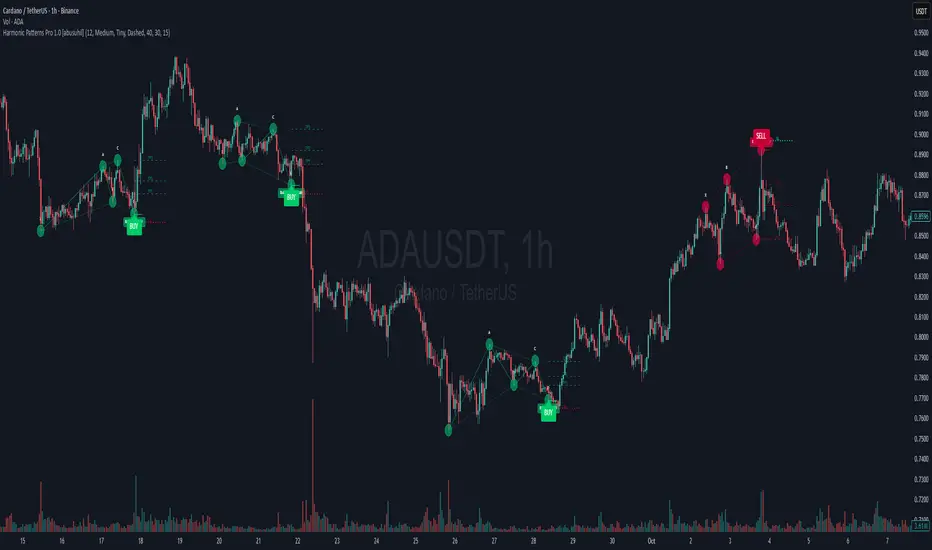
Signalgo VSignalgo V: Technical Overview and Unique Aspects
Signalgo V is a technical indicator for TradingView that integrates multiple layers of analysis: moving averages, MACD, Bollinger Bands and RSI to deliver buy and sell signals. Below is an informational breakdown of how the indicator functions, its input parameters, signal logic, exit methodology, and how it stands apart from traditional moving average (MA) tools, without disclosing specifics that allow for code duplication.
How Signalgo V Works
1. Multi-Layered Technical Synthesis
Signalgo V processes several technical studies simultaneously:
Fast/Slow Moving Averages: Uses either EMA or SMA (user-selected) with adjustable periods. These are central to initial trend detection through crossovers.
MACD Filter: MACD line vs. signal line cross-check ensures trend direction is supported by both momentum and MA structure.
RSI Confirmation: The RSI is monitored to verify that signals are not excessively overbought or oversold, tuning the system to changing momentum regimes.
Bollinger Bands Context: Entry signals are only considered when price action is beyond the Bollinger Bands envelope, which further filters for unusually strong movements.
These strict, multi-indicator entry criteria are designed to ensure only the most robust signals are surfaced, each is contingent on the presence of aligned trend, momentum and volatility.
2. Exit Methodology
Take-Profit Levels: After entering a trade, the strategy automatically sets three predefined profit targets (TP1, TP2, TP3). If the price reaches any of these targets, the system marks it, helping you lock in profits at different stages.
Stop-Loss System: Simultaneously, a stop-loss (SL) value is set, protecting you from significant losses if the market moves against your position.
Dynamic Adjustment: When the first profit target (TP1) is hit, the system can automatically move the stop-loss to your entry price. This means your worst-case outcome is break-even from that point, reducing downside risk.
Trailing Stop-Loss: After TP1 is reached, a dynamic trailing stop can activate. This allows the stop-loss to follow the price as it moves in your favor, aiming to capture more profit if the trend continues, while still protecting your gains if the price reverses.
Visual Markers: The system plots all important exit levels (profit targets, stop-loss, trailing stop) directly on the chart. Optional labels also appear whenever a target or stop-loss is hit, making it easy to see progress.
Visual cues (labels) are plotted directly on the bar where a buy or sell signal triggers, clarifying entry points and aiding manual exit/risk management decisions.
Input Parameters
rsiLen: Lookback period for RSI calculation.
rsiOB and rsiOS: Overbought/oversold thresholds, adaptive to the indicator’s multi-layered logic.
maFastLen and maSlowLen: Periods for fast and slow MAs.
maType: EMA or SMA selectable for both MAs.
bbLen: Length for Bollinger Bands mean calculation.
bbMult: Standard deviation multiplier for BB width.
macdFast, macdSlow, macdSig: Standard MACD parameterization for nuanced momentum oversight.
What Separates Signalgo V from Traditional Moving Average Indicators
Composite Signal Architecture: Where traditional MA systems generate signals solely on MA crossovers, Signalgo V requires layered, cross-confirmational logic across trend (MAs), momentum (MACD), volatility (Bollinger Bands), and market strength (RSI).
Adaptive Volatility Context: MA signals only “count” when price is meaningfully breaking out of its volatility envelope, filtering out most unremarkable crosses that plague basic MA strategies.
Integrated Multi-Factor Filters: Strict compliance with all layers of signal logic is enforced. A marked improvement over MA strategies that lack secondary or tertiary confirmation.
Non-Redundant Event Limiting: Each entry is labeled as a unique event. The indicator does not repeat signals on subsequent bars unless all entry conditions are freshly met.
Trading Strategy Application
Trend Identification: By requiring concurrence among MA, MACD, RSI, and BB, this tool identifies only those trends with robust, multifactor support.
Breakout and Momentum Entry: Signals are bias-toward trades that initiate at likely breakout points (outside BB range), combined with fresh momentum and trend alignment.
Manual Discretion for Exits: The design is to empower traders with high-confidence entries and leave risk management or partial profit-taking adaptive to trader style, using visual cues from all component indicators.
Alert Generation: Each buy/sell event optionally triggers an alert, supporting systematic monitoring without constant chart watching.
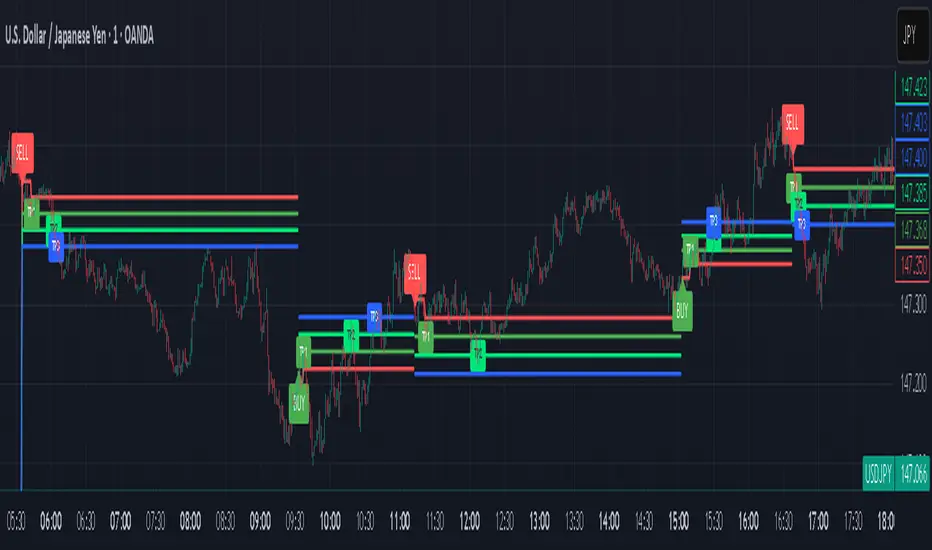
EMA ZONE MASTER [By TraderMan]🟢 EMA Zone Master Indicator Explanation 🚀
🌟 What is the EMA Zone Master?
The EMA Zone Master is a powerful TradingView Pine Script indicator designed to help traders identify trends, entry points, and manage trades with precision. It leverages a 200-period EMA (Exponential Moving Average) to create a dynamic zone for spotting bullish 📈 and bearish 📉 trends. The indicator provides clear buy/sell signals, take-profit (TP) levels, and stop-loss (SL) levels, making it ideal for both novice and experienced traders! 💪
🔍 How Does It Work?
The indicator uses the 200-period EMA as its core, surrounded by a zone defined by a percentage offset (default 0.3%). Here's how it operates:
Trend Detection 🧠:
The price's position relative to the EMA zone determines the trend:
Above the zone (with tolerance and minimum distance) signals a bullish trend (BUY 📈).
Below the zone signals a bearish trend (SELL 📉).
A neutral trend occurs when the price is within the zone or lacks momentum.
A trend is confirmed after a set number of bars (default 3) to filter out noise. 🔎
Trade Signals 🚦:
Buy Signal: Triggered when the price breaks above the EMA zone with confirmation.
Sell Signal: Triggered when the price breaks below the EMA zone with confirmation.
Signals are visualized with labels ("BUY" or "SELL") on the chart for clarity. ✅
Position Management 🎯:
Entry Price: Set at the closing price when a signal is triggered.
Take-Profit Levels: Three TP levels (TP1, TP2, TP3) are calculated based on a Risk/Reward Ratio (default 0.7).
Stop-Loss: Calculated using the ATR (Average True Range) with a multiplier (default 6.0) for volatility-based protection. 🛡️
Lines and labels for entry, TP, and SL are drawn on the chart for easy tracking.
Trend Strength 💪:
The indicator calculates trend strength (0-100%) and categorizes it as Very Strong, Strong, Moderate, Weak, or Very Weak. This helps gauge the reliability of the trend. 🌡
Analysis Comment 📝:
A dynamic comment provides professional insights based on trend strength, guiding traders on whether to act or wait. 🧑💼
Visuals & Alerts 🔔:
The EMA, zone boundaries, and candlestick colors change based on the trend (green for bullish, red for bearish, gray for neutral).
A table in the top-right corner summarizes key data: trend direction, strength, entry price, TP/SL levels, and success rate.
Alerts are generated with detailed trade information when a new signal appears.
🛠 How to Use It?
Setup on TradingView ⚙️:
Add the EMA Zone Master to your chart via the TradingView Pine Script editor.
Customize settings like EMA Length (default 200), Zone Width (0.3%), ATR Period (50), and Risk/Reward Ratio (0.7) to suit your trading style. 🛠
Interpreting Signals 📊:
Buy Signal (AL): Look for a "BUY" label and green candlesticks when the price breaks above the EMA zone. 📈
Sell Signal (SAT): Look for a "SELL" label and red candlesticks when the price breaks below the EMA zone. 📉
Check the table for trend strength and analysis comments to confirm the signal's reliability.
Opening a Position 💸:
Long Position: Enter a buy trade when a "BUY" signal appears. Set your take-profit at TP1, TP2, or TP3 and stop-loss at the SL level shown on the chart.
Short Position: Enter a sell trade when a "SELL" signal appears. Use the TP and SL levels provided.
The indicator automatically plots these levels as lines and labels for easy reference. 🎯
Managing Trades 🕒:
Monitor the trade's progress via the table and labels.
The indicator tracks if TP1, TP2, or TP3 is hit or if the trade stops out, updating the Last Result in the table (e.g., "✅ TP1 SUCCESS" or "❌ STOPPED OUT").
Use the Success Rate (displayed in the table) to gauge historical performance (75% for BUY, 65% for SELL, 50% for NEUTRAL).
Using Alerts 🔔:
Set up alerts in TradingView to receive notifications when a buy or sell signal is triggered.
The alert message includes the trend, strength, entry price, TP/SL levels, success rate, and analysis comment for quick decision-making.
📈 How to Open a Position?
Wait for a Signal: Ensure a "BUY" or "SELL" label appears, and the trend strength is at least Moderate (40%+) for higher confidence. ✅
Check the Table: Review the trend direction, strength, and analysis comment to confirm the trade setup. 📊
Enter the Trade:
For a Buy: Enter at the entry price shown, set TP1/TP2/TP3 and SL as indicated by the lines/labels.
For a Sell: Same process, but for a short position.
Monitor: Watch for TP or SL hits. The indicator will update the table with the result (e.g., "✅ TP3 SUCCESS"). 🕒
Risk Management: Always adhere to the stop-loss level to limit losses, and consider partial profit-taking at TP1 or TP2 for safer trading. 🛡️
🎉 Why Use EMA Zone Master?
Clear Signals: Easy-to-read buy/sell signals with visual cues. 🚦
Automated Levels: Pre-calculated TP and SL levels save time and reduce errors. 🧮
Trend Strength Insight: Helps avoid weak trends and focus on high-probability setups. 💪
Professional Analysis: Dynamic comments guide your trading decisions. 🧑💼
Customizable: Adjust settings to match your trading style or market conditions. ⚙️
Alert System: Stay informed with detailed alerts for timely action. 🔔
⚠️ Tips for Success
Confirm with Other Tools: Use additional indicators (e.g., RSI, MACD) to validate signals. 🔍
Test First: Backtest the indicator on your preferred market/timeframe to understand its performance. 📉
Risk Management: Always use proper position sizing and respect stop-loss levels. 🛑
Higher Timeframes: The indicator works best on higher timeframes (e.g.,15MİN, 1H, 4H, Daily) for stronger signals. ⏰
Happy trading with EMA Zone Master! 🚀 Let it guide you to smarter, more confident trades. 💰 Feel free to tweak settings and share your results! 😊

TradePlanner ProPlan smarter. Trade with precision.
TradePlanner Pro is a professional-grade overlay tool designed to streamline your trading decisions by visually organizing your trade plans directly on the chart. Built for traders who value preparation and clarity, this script enables precise entry planning, risk management, and target visualization—all tailored per symbol.
Core Purpose
TradePlanner Pro helps you map out potential trades using pre-defined symbol-based presets. It dynamically calculates position sizes based on your account size or fixed risk, then visualizes key trade levels (Entry, Take Profits, Stop Loss) with profit/loss metrics in both dollar and percentage terms. It's the perfect companion for traders who prepare their setups in advance and want their plans clearly represented on the chart.
Key Features
🔹 Per-Symbol Presets: Define entries, up to 3 take-profit levels, and stop-losses for each ticker.
🔹 Dynamic Risk Sizing: Choose between percentage-based risk or fixed dollar risk per trade.
🔹 Visual Trade Mapping: Automatically plots Entry, TP1–TP3, and SL lines on your chart.
🔹 Real-Time P&L Labels: Displays profit/loss amounts and percentages, with optional R/R ratios.
🔹 Custom Investment Display: Shows how much capital is allocated per trade.
🔹 Clean, Configurable UI: Adjust label positions, font sizes, opacity, and label visibility to match your style.
Whether you're swing trading or day trading, TradePlanner Pro helps you stay disciplined, organized, and confident in your execution.
How to Use TradePlanner Pro – Step-by-Step Guide
TradePlanner Pro is designed to be easy to set up while giving you full control over how your trades are visualized and calculated. Here’s how to get started:
1. Start with Default Settings
By default, the script assumes:
Account Size: $10,000
Max Money per Trade (%): 1.0%
Max Risk (USD): 0 (disabled; only percentage risk is used)
This means the script will size each trade to risk 1% of your account balance per trade unless you override it with a fixed USD risk amount.
2. Set Up Your Symbol Presets
The "Symbol Presets" input is a flexible text area where you define trade setups for each ticker.
Format (one per line):
SYMBOL:Entry,TP1 ,SL
Example:
AAPL:250,260,270,240
MSFT:100,110,90
TSLA:180,200,170
You can include 1 to 3 take-profit levels.
The script will only activate for the current chart’s symbol, matching what's listed.
3. Customize Risk Parameters
You can use:
Account % Risk – Based on account size and % risk.
Fixed USD Risk – When a dollar amount is entered (>0), it takes priority and calculates share size based on the risk per share.
There's also an option to round share quantities down to whole units, which is useful for stock or crypto trading platforms that only allow whole-number units.
4. Choose What to Display
Toggle on/off these elements as needed:
Show Entry/TP/SL Lines
Show P&L Labels – Profit/loss amounts at each target and SL.
Show Amount Invested – Includes total dollar value in the quantity label.
Show Percentages – Adds % gain/loss to each label.
Show Risk/Reward Ratios – Optionally displayed beside or below TP labels.
You can further adjust:
Font size and label opacity
Label position offset – In percent of price range, so they don’t overlap the actual levels.
5. Read the Visual Outputs
Once the preset matches the current chart symbol:
Lines will appear for Entry, TP1-TP3, and Stop Loss.
Labels will display your:
Trade quantity (and invested amount)
Dollar and % profit at each target
Total loss at stop loss
Optional R/R ratios
Everything updates dynamically and adjusts to your current chart scale and bar availabilit

Palgo Trading - Palgo🎯THE PALGO INDICATOR
The "Palgo Trading - Palgo" indicator, developed by PALGOTRADING is a sophisticated technical analysis tool designed to identify potential buy and sell signals by combining trend analysis with momentum and optional AI-driven sentiment assessment. This indicator provides a clear visual representation of potential trading opportunities directly on the price chart.
At its core, the Palgo indicator synthesizes information from well-established technical analysis concepts with statistical functions, and has optional AI Integration for social analysis of the asset using external data :
Supertrend: This indicator identifies the prevailing trend direction. A positive Supertrend value suggests an upward trend, while a negative value indicates a downward trend. The Palgo indicator utilizes a Supertrend with a customizable multiplier and a user-configurable Average True Range (ATR) length (defaulting to 21).
🛜Signal Generation Logic
The indicator generates buy and sell signals based on a calculated "final direction" value. This value is derived by combining the Supertrend direction and a modified RSI. The modification involves scaling the RSI output to a range of -0.5 to 0.5 and then further adjusting it.
The buy and sell conditions are as follows:
Buy Signal: A buy signal is triggered when the "final direction" crosses above a positive activation threshold while the current signal is not already bullish. Upon signal generation, a "Buy" label (colored green) appears below the bar, and initial Take Profit (TP) and Stop Loss (SL) levels are calculated and stored.
Sell Signal: Conversely, a sell signal is triggered when the "final direction" crosses below a negative activation threshold while the current signal is not already bearish. A "Sell" label (colored red) is plotted above the bar, and corresponding TP and SL levels are determined.
✅ Optimized Take-Profit / Stop-Loss
The Take-Profit (TP) & Stop-Loss (SL) signals are optimized with Kernel Density Estimation (KDE), the script uses KDE activated by gaussian function on previous pivot points and trains the model, then tries to estimate new pivot points early, to determine new TP / SL levels for the current signal. Kernel Density Estimation takes values of the previous confirmed pivots' RSI values, body size & more factors to determine their role. This indicator can generate up to 5 TP signals per signal.
📈 Signal Trail
Palgo also includes a "Signal Trail" that visually shows the market's momentum. This trail is like a dynamic line that follows the price.
When the market is in an uptrend and looking strong, you'll see a green trail.
When it's in a downtrend and looking weak, you'll see a red trail.
This trail helps you see if the market is currently aligned with Palgo's bullish (buy) or bearish (sell) signal. It also acts as a visual guide for potential support or resistance levels.
📊Backtesting Dashboard
The Palgo indicator includes an optional Backtesting Dashboard to help you understand its historical performance. This dashboard appears directly on your chart and provides a quick summary of how the indicator's signals have performed in the past.
Here's what you'll see on the dashboard:
Sensitivity: This shows the specific "Sensitivity" setting you've chosen for the indicator. This setting influences how often signals are generated.
Wins: This number tells you how many trades initiated by the Palgo indicator historically ended in profit (reached a Take-Profit target or closed profitably when the signal reversed).
Loss: This number indicates how many trades historically ended in a loss (hit the Stop-Loss).
Winrate: This is a very important metric, displayed as a percentage. It shows you the proportion of winning trades compared to the total number of trades (Wins / (Wins + Loss)). A higher winrate generally suggests a more effective strategy.
This dashboard is a valuable tool for reviewing the indicator's effectiveness with different settings and helping you make informed decisions about its use in your trading.
🤖AI Integration (Optional):
A unique feature of the Palgo indicator is the optional integration of Artificial Intelligence (AI) sentiment analysis. When the "Use AI" input is enabled, the indicator incorporates two additional user-defined inputs:
Impression Change %: This input represents the percentage change in overall market sentiment as assessed by an external AI.
Positivity Change: This input reflects the change in positive sentiment, also provided by an AI.
These AI inputs are combined to create an "AI Score," which then influences the "final direction" calculation. A positive AI Score amplifies the bullish signals and dampens bearish signals, while a negative AI Score has the opposite effect.
❓Why PALGO ?
All-in-One Analysis: Palgo combines trend, momentum, and advanced statistical analysis into one easy-to-use tool, giving you a complete picture without needing multiple indicators.
Dynamic Profit & Loss Management: Unlike many tools with fixed targets, Palgo's smart profit and stop-loss system adapts to the market using KDE. This helps you potentially capture more gains and limit losses effectively.
Optional AI Insights: For an extra edge, Palgo can tap into Artificial Intelligence (AI) to gauge overall market mood. If the AI sees a lot of positive buzz, it can strengthen buy signals; if it's negative, it can reinforce sell signals. This helps you trade with a better understanding of the market's pulse.
Clear and Customizable: Palgo is designed to be very visual. It changes the color of the price bars, adds clear "Buy" or "Sell" labels, and marks your profit and stop-loss points. You can also change the colors to suit your preference.
Palgo aims to be a comprehensive and adaptable trading tool, giving you clearer insights.
⚙️Visualizations and Customization
The Palgo indicator offers several visual cues to aid traders:
Bar Coloring: The price bars are colored green when the indicator identifies a bullish signal and red during a bearish signal.
Signal Labels: Clear "Buy" and "Sell" labels are plotted at the signal generation points.
Take Profit and Stop Loss Markers: Distinct shapes and labels indicate when the price reaches the calculated TP and SL levels.
Style Options: Users can customize the colors for bullish and bearish bars, text, and TP/SL markers within the indicator's settings.
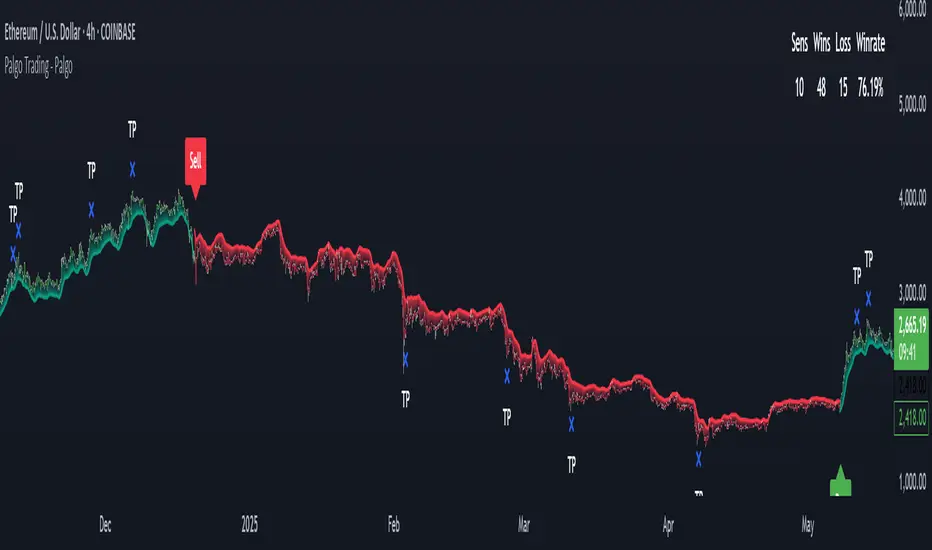
GZ Indicator✍️ Description:
GZ Indicator is an advanced indicator that automatically detects Golden Zones, optimal market entry zones based on the latest significant pivots. The system uses Fibonacci extensions to project precise price targets, while providing a dynamic, visual stop-loss.
Main features:
- Pivot Detection: Automatic identification of significant pivots (high/low).
- Optimal Entry Zones (OTE): Automatically calculates ideal entry zones based on Fibonacci retracements.
- Precise Targets: Displays price targets with Fibonacci extensions.
- Dynamic Stop-Loss: Visual stop-loss zone adjusted to market conditions.
- RSI and MACD display: Add an RSI and MACD chart to facilitate trend analysis and confirm your entries.
- Intelligent refresh: Automatic deletion of the active zone as soon as the stop-loss is reached.
🔥 Key features:
Automatic detection of significant pivots (highs and lows)
Dynamic calculation of the OTE (Optimal Trade Entry) zone on retracements 0.618 - 0. 705
Clear display of price targets based on extensions
Intelligent updating: old zones are retained for historical analysis
Automatic deletion of current zone if Stop-Loss is reached
Contextual RSI and MACD chart for improved trend analysis
Code optimized for minimum recalculations, fluid even on fast time units.
⚡ How to use it:
Spot the appearance of a Golden Zone.
Enter a position in the zone with RSI/MACD or price action confirmation.
Use the targets displayed to set your progressive Take-Profits.
Respect the Stop-Loss zone automatically drawn.
🛠️ Available parameters:
Activate/deactivate RSI/MACD chart
Choose number of pivots for detection
Display old targets
[⚠️ Disclaimer:
This indicator is a decision-making tool. It is not intended to be used as financial advice. Please always perform your own analysis and manage your risks properly.
🔥 Bon trading ! 🚀

ICT Swiftedge# ICT SwiftEdge: Advanced Market Structure Trading System
**Overview**
ICT SwiftEdge is a powerful trading system built upon the foundation of ICTProTools' ICT Breakers, licensed under the Mozilla Public License 2.0 (mozilla.org). This script has been significantly enhanced by to combine market structure analysis with modern technical indicators and a sleek, AI-inspired statistics dashboard. The goal is to provide traders with a comprehensive tool for identifying high-probability trade setups, managing exits, and tracking performance in a visually intuitive way.
**Credits**
This script is a derivative work based on the original "ICT Breakers" by ICTProTools, used with permission under the Mozilla Public License 2.0. Significant enhancements, including RSI-MA signals, trend filtering, dynamic timeframe adjustments, dual exit strategies, and an AI-style statistics dashboard, were developed by . We express our gratitude to ICTProTools for their foundational work in market structure analysis.
**What It Does**
ICT SwiftEdge integrates multiple trading concepts to help traders identify and manage trades based on market structure and momentum:
- **Market Structure Analysis**: Identifies Break of Structure (BOS) and Market Structure Shift (MSS) patterns, which signal potential trend continuations or reversals. BOS indicates a continuation of the current trend, while MSS highlights a shift in market direction, providing key entry points.
- **RSI-MA Signals**: Generates "BUY" and "SELL" signals when BOS or MSS patterns align with the Relative Strength Index (RSI) smoothed by a Moving Average (RSI-MA). Signals are filtered to occur only when RSI-MA is above 50 (for buys) or below 50 (for sells), ensuring momentum supports the trade direction.
- **Trend Filtering**: Prevents multiple signals in the same trend, ensuring only one buy or sell signal per trend direction, reducing noise and improving trade clarity.
- **Dynamic Timeframe Adjustment**: Automatically adjusts pivot points, RSI, and MA parameters based on the selected chart timeframe (1M to 1D), optimizing performance across different market conditions.
- **Flexible Exit Strategies**: Offers two user-selectable exit methods:
- **Trailing Stop-Loss (TSL)**: Exits trades when price moves against the position by a user-defined distance (in points), locking in profits or limiting losses.
- **RSI-MA Exit**: Exits trades when RSI-MA crosses the 50 level, signaling a potential loss of momentum.
- Users can enable either or both strategies, providing flexibility to adapt to different trading styles.
- **AI-Style Statistics Dashboard**: Displays real-time trade performance metrics in a futuristic, neon-colored interface, including total trades, wins, losses, win/loss ratio, and win percentage. This helps traders evaluate the system's effectiveness without external tools.
**Why This Combination?**
The integration of these components creates a synergistic trading system:
- **BOS/MSS and RSI-MA**: Combining market structure breaks with RSI-MA ensures entries are based on both price action (structure) and momentum (RSI-MA), increasing the likelihood of high-probability trades.
- **Trend Filtering**: By limiting signals to one per trend, the system avoids overtrading and focuses on significant market moves.
- **Dynamic Adjustments**: Timeframe-specific parameters make the system versatile, suitable for scalping (1M, 5M) or swing trading (4H, 1D).
- **Dual Exit Strategies**: TSL protects profits during trending markets, while RSI-MA exits are ideal for range-bound or reversing markets, catering to diverse market conditions.
- **Statistics Dashboard**: Provides immediate feedback on trade performance, enabling data-driven decision-making without manual tracking.
This combination balances technical precision with user-friendly visuals, making it accessible to both novice and experienced traders.
**How to Use**
1. **Add to Chart**: Apply the script to any TradingView chart.
2. **Configure Settings**:
- **Chart Timeframe**: Select your chart's timeframe (1M to 1D) to optimize parameters.
- **Structure Timeframe**: Choose a timeframe for market structure analysis (leave blank for chart timeframe).
- **Exit Strategy**: Enable Trailing Stop-Loss (`useTslExit`), RSI-MA Exit (`useRsiMaExit`), or both. Adjust `tslPoints` for TSL distance.
- **Show Signals/Labels**: Toggle `showSignals` and `showExit` to display "BUY", "SELL", and "EXIT" labels.
- **Dashboard**: Enable `showDashboard` to view trade statistics. Customize colors with `dashboardBgColor` and `dashboardTextColor`.
3. **Trading**:
- Look for "BUY" or "SELL" labels to enter trades when BOS/MSS aligns with RSI-MA.
- Exit trades at "EXIT" labels based on your chosen strategy.
- Monitor the statistics dashboard to track performance (total trades, win/loss ratio, win percentage).
4. **Alerts**: Set up alerts for BOS, MSS, buy, sell, or exit signals using the provided alert conditions.
**License**
This script is licensed under the Mozilla Public License 2.0 (mozilla.org). The source code is available for review and modification under the terms of this license.
**Compliance with TradingView House Rules**
This publication adheres to TradingView's House Rules and Scripts Publication Rules. It provides a clear, self-contained description of the script's functionality, credits the original author (ICTProTools), and explains the rationale for combining indicators. The script contains no promotional content, offensive language, or proprietary restrictions beyond MPL 2.0.
**Note**
Trading involves risk, and past performance is not indicative of future results. Always backtest and validate the system on your preferred markets and timeframes before live trading.
Enjoy trading with ICT SwiftEdge, and let data-driven insights guide your decisions!

Trend Zone Moving Averages📈 Trend Zone Moving Averages
The Trend Zone Moving Averages indicator helps traders quickly identify market trends using the 50SMA, 100SMA, and 200SMA. With dynamic background colors, customizable settings, and real-time alerts, this tool provides a clear view of bullish, bearish, and extreme trend conditions.
🔹 Features:
Trend Zones with Dynamic Background Colors
Green → Bullish Trend (50SMA > 100SMA > 200SMA, price above 50SMA)
Red → Bearish Trend (50SMA < 100SMA < 200SMA, price below 50SMA)
Yellow → Neutral Trend (Mixed signals)
Dark Green → Extreme Bullish (Price above all three SMAs)
Dark Red → Extreme Bearish (Price below all three SMAs)
Customizable Moving Averages
Toggle 50SMA, 100SMA, and 200SMA on/off from the settings.
Perfect for traders who prefer a cleaner chart.
Real-Time Trend Alerts
Get instant notifications when the trend changes:
🟢 Bullish Zone Alert – When price enters a bullish trend.
🔴 Bearish Zone Alert – When price enters a bearish trend.
🟡 Neutral Zone Alert – When trend shifts to neutral.
🌟 Extreme Bullish Alert – When price moves above all SMAs.
⚠️ Extreme Bearish Alert – When price drops below all SMAs.
✅ Perfect for Any Market
Works on stocks, forex, crypto, and commodities.
Adaptable for day traders, swing traders, and investors.
⚙️ How to Use: Trend Zone Moving Averages Strategy
This strategy helps traders identify and trade with the trend using the Trend Zone Moving Averages indicator. It works across stocks, forex, crypto, and commodities.
🟢 Bullish Trend Strategy (Green Background)
Objective: Look for buying opportunities when the market is in an uptrend.
Entry Conditions:
✅ Background is Green (Bullish Zone).
✅ Price is above the 50SMA (confirming strength).
✅ Price pulls back to the 50SMA and bounces OR breaks above a key resistance level.
Stop Loss:
🔹 Place below the most recent swing low or just under the 50SMA.
Take Profit:
🔹 First target at the next resistance level or recent swing high.
🔹 Second target if price continues higher—trail stops to lock in profits.
🔴 Bearish Trend Strategy (Red Background)
Objective: Look for shorting opportunities when the market is in a downtrend.
Entry Conditions:
✅ Background is Red (Bearish Zone).
✅ Price is below the 50SMA (confirming weakness).
✅ Price pulls back to the 50SMA and rejects OR breaks below a key support level.
Stop Loss:
🔹 Place above the most recent swing high or just above the 50SMA.
Take Profit:
🔹 First target at the next support level or recent swing low.
🔹 Second target if price keeps falling—trail stops to secure profits.
🌟 Extreme Trend Strategy (Dark Green / Dark Red Background)
Objective: Trade with momentum when the market is in a strong trend.
Entry Conditions:
✅ Dark Green Background → Extreme Bullish: Price is above all three SMAs (strong uptrend).
✅ Dark Red Background → Extreme Bearish: Price is below all three SMAs (strong downtrend).
Trade Execution:
🔹 For longs (Dark Green): Look for breakout entries above resistance or pullbacks to the 50SMA.
🔹 For shorts (Dark Red): Look for breakdown entries below support or rejections at the 50SMA.
Risk Management:
🔹 Use tighter stop losses and trail profits aggressively to maximize gains.
🟡 Neutral Trend Strategy (Yellow Background)
Objective: Avoid trading or wait for a breakout.
What to Do:
🔹 Avoid trading in this zone—price is indecisive.
🔹 Wait for confirmation (background turns green/red) before taking a trade.
🔹 Use alerts to notify you when the trend resumes.
📌 Final Tips
Use this strategy with price action for extra confirmation.
Combine with support/resistance levels to improve accuracy.
Set alerts for trend changes so you never miss an opportunity.
Enjoy!
